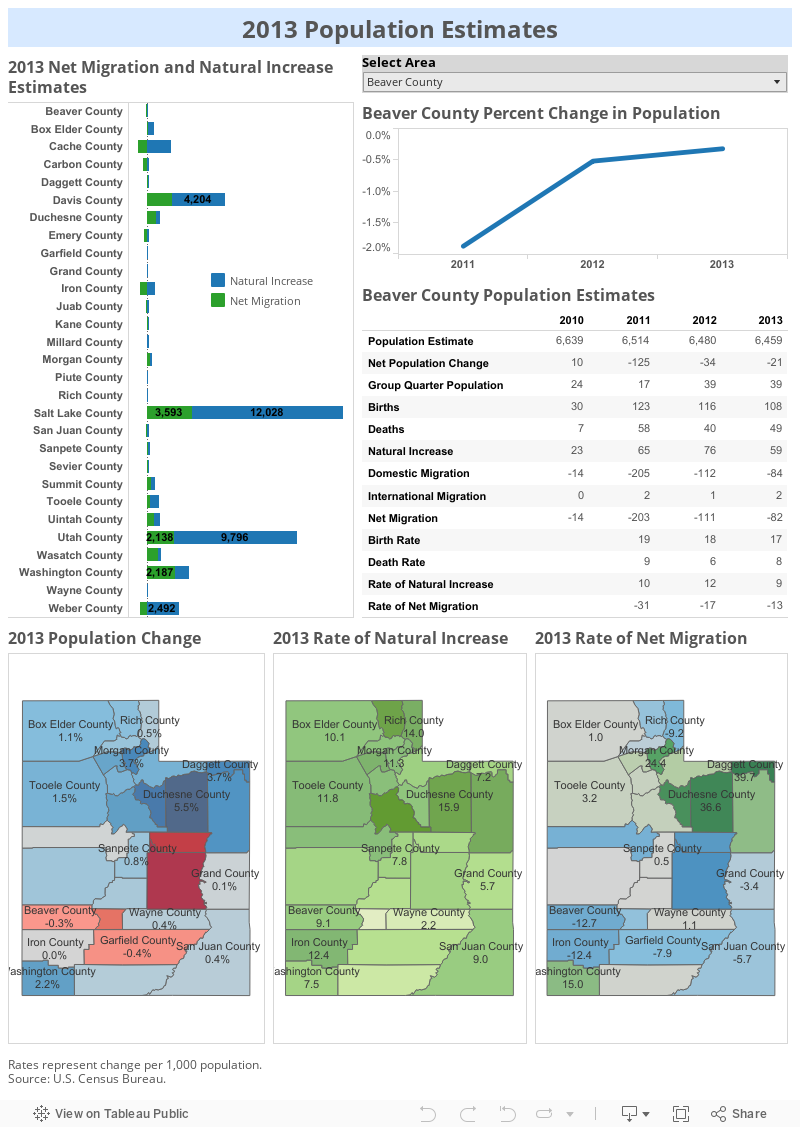
According to the 2013 estimates, southwestern Utah counties showed a wide variation of population change. With 2.2 percent expansion, Washington County showed the strongest population expansion — notably stronger than the statewide rate of 1.6 percent. (Counties in the Uintah Basin plus Morgan and Wasatch counties exhibited the most rapid growth.) Holding to the middle of the road, Iron County’s population showed essentially no change and Kane County’s population was up only 0.5 percent. On the other hand, Beaver and Garfield counties joined three other Utah counties with a slight population loss.
Washington County stands out compared to most Utah counties in the population estimates arena. The largest share of Washington County population growth can be attributed to net migration (the difference between individuals moving in and moving out of the area) rather than natural increase (more births than deaths). Only Duchesne County, with its influx of energy workers, showed this same phenomenon.
All southwest Utah counties experienced positive natural increase as births outnumbered deaths. Those counties with contracting populations experienced net out-migration. Beaver and Iron counties displayed the highest rates of net out-migration (net migration per 1,000 population). In contrast, Iron County also showed the highest rate of natural increase in southwest Utah with Beaver County ranking second.
The following visualization allows you to observe and download data for your particular county.