Thursday, May 28, 2020

Unemployment Insurance Claims Data Shed Light on the Local Economic Impacts of the COVID-19 Pandemic in Southwest Utah


By Lecia Parks Langston, Senior Economist


“You have power over your mind — not outside events. Realize this, and you will find strength.” Marcus Aurelius

In the wake of the COVID-19 pandemic, businesses lost revenues and workers lost jobs. But because of the time it takes to collect and collate data, economists have been left without much information to quantify the economic impacts at the local level.

But there is one ray of data illumination. Claims for unemployment benefits are promptly available and provide information about a large cross section of the economy. This post will outline what light unemployment claims data sheds on the state of southwest Utah’s economy.

While not all workers are protected by unemployment insurance laws, roughly 95% of jobs are covered. This makes claims data an exceptional source of information about the economy. Not included under unemployment insurance laws are most self-employed workers, about half of agricultural employment, unpaid family workers, railroad personnel (covered separately) and many nonprofit organizations (such as churches). Also, some out-of-work employees may not have worked a sufficient work history to qualify for unemployment insurance benefits, but may file anyway. Fortunately, in this time of economic distress, the social safety nets of the unemployment insurance program, special national COVID-19 funding and social programs are working together to keep workers’ income and well-being stable.

Unemployment claimants and the unemployed; they aren’t the same


Also, keep in mind that, in addition to individuals drawing unemployment benefits, the unemployment rate includes those entering and re-entering the workforce and noncovered groups without current employment. This means the number of “unemployed” will be greater than the number of claimants. In “normal” times, only about 40% of the “unemployed” are claiming benefits. The generally reported unemployment rate also has a work-search requirement. If you haven’t made any minimal attempts to find work, you aren’t counted as “unemployed.”

Watch this Space


While this analysis won’t be updated regularly, new data will be added to the data visualization on a weekly basis allowing readers to check back for the latest information.


An Unprecedented Event


Not surprisingly, first-time claims for unemployment benefits soared in Utah and across the nation as the pandemic swept across the country. This increase is unprecedented since the creation of unemployment insurance coverage during the Great Depression. Week 12 (beginning March 16) marks the start of this unparalleled surge in claims. On a positive note, while new claims for unemployment benefits have skyrocketed in Utah, the state currently shows one of the lowest claims rates in the nation.

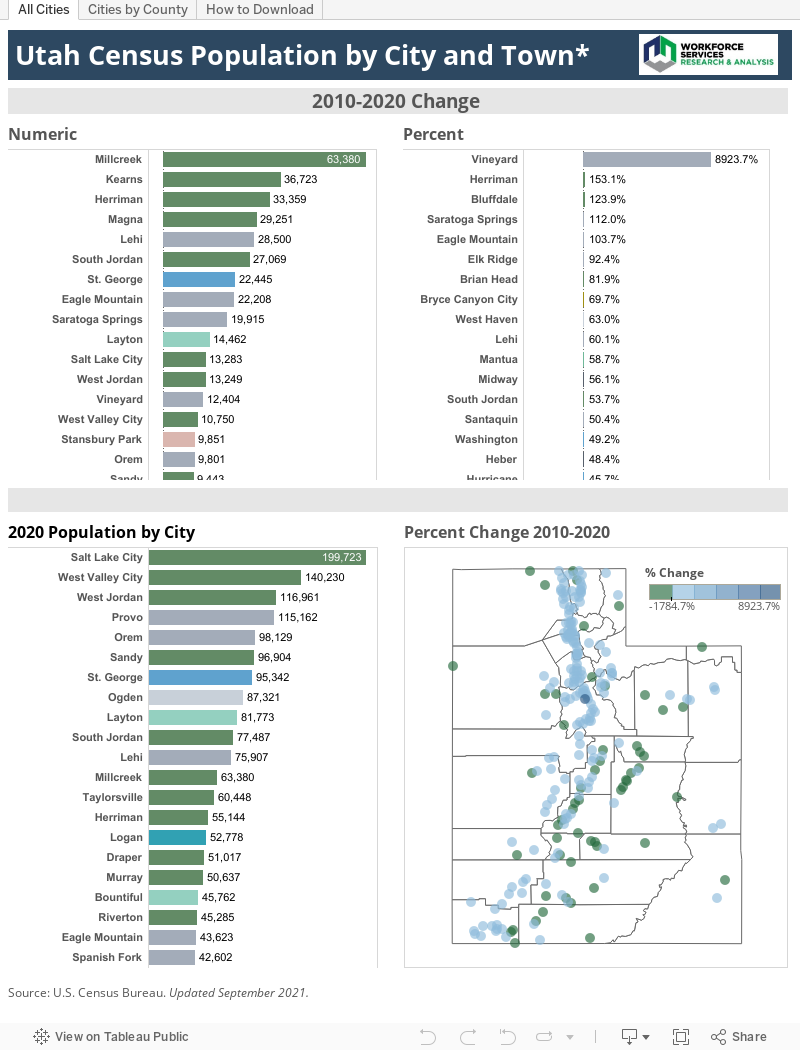
For most southwest Utah counties, initial claims peaked during week 13 (starting March 23) and have since tapered downward. During the peak week 13, initial claims filed totaled 2,364 in southwest Utah. In all of 2019, only 3,803 claims were filed in the region. By week 19, claims measured considerably lower but continued to run substantially greater than in previous years — even during the Great Recession.

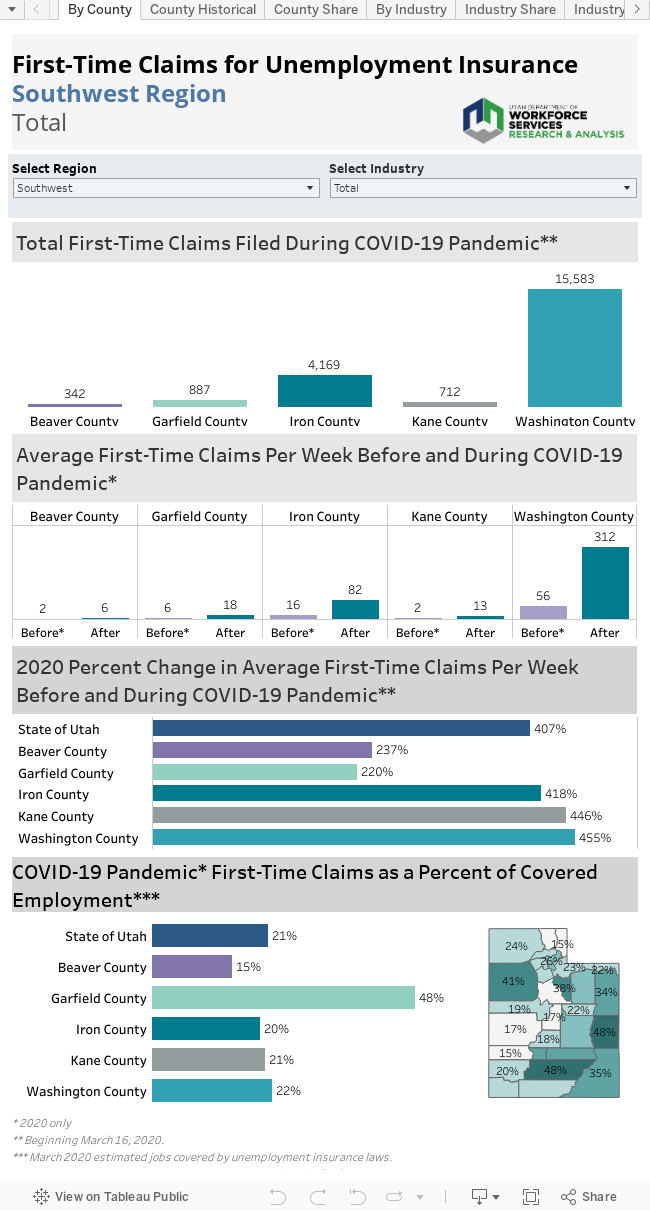
Here’s another example of the tremendous flood of new claims. Prior to the COVID-19 pandemic, counties in southwest Utah averaged a total of 82 first-time claims per week. This time period in early 2020 included seasonally high claims weeks in January. In the weeks after, an average of 1,343 claims were filed for an almost unbelievable increase of 1,538%.

Who took the hardest hit?


Counties with a high-dependence on tourism have felt the greatest economic and employment shocks. In Garfield County, with the highest share of tourism-related employment in the state, roughly 20% of individuals covered by unemployment insurance have filed a claim — twice the rate of the state (10%) Moreover, many seasonal Garfield County workers were already drawing unemployment before the pandemic hit. In contrast, in Beaver County, only 4% of covered workers filed a claim during the pandemic. Iron (9%), Kane (10%) and Washington (11%) also felt the repercussions of upswing in furloughs and job loss.

Tourism and COVID-19


Especially in the early stages of the pandemic, this is a story of tourism-dependent industries. Almost 23% of post-COVID-19 initial claims filed in southwest Utah represented workers previously employed in accommodations and food services. In addition, the true effect of the pandemic on this industry is masked by a large number of claims classified as industry “unknown” in the early days of the claims flood. Undoubtedly, many of these claims would rightfully be classified in accommodations/food services if the appropriate information were available.

Other high-claims industries included retail trade, healthcare/social assistance (reflecting the cessation of elective procedures and visits) and administrative support/waste management/remediation (the home to temporary employment agencies). Many of these high-claim industries reflect their high share of total employment in general. In addition, they often serve the public face to face or encountered damage due to the decline in demand for travel.

The Industry Flow


While most of the high-claim industries felt the pain of the pandemic early on, other industries surged in later weeks. As the economic effects of other closures worked their way through the economy both manufacturing and transportation/warehousing proved relative latecomers to the layoffs in southwest Utah.

The High and the Low


Although accommodations/food services has generated the largest number of southwest Utah initial claims in the COVID-19 pandemic time period, in percentage terms, other industries have actually suffered more. For example, in the extremely small management of companies industry, roughly 50% of workers have filed for claims. The administrative support/waste management/remediation industries, which includes temporary employment firms, shows a first-time claims rate of 27%.

Because of its job-to-job nature, the construction industry typically accounts for 15-20% of first-time claims. However, although construction’s new claims have also increased, they have increased at a much slower-than-average rate. After the COVID-19 pandemic hit, construction contributed only about 5% of first-time claims. Ease of social-distancing and good weather have helped construction maintain employment levels. New claims measured just 3% of covered construction employment.

Only a portion of agricultural employment is covered by unemployment insurance laws. However, as companies work to keep America fed, agribusiness has laid off few employees. In Iron and Beaver counties, covered agriculture plays a notable role in the economy. However, only 1% of southwest Utah’s covered agricultural workers have filed a claim during the COVID-19 pandemic.

Public administration, educational services (including public and higher education), finance/insurance and utilities have also managed to keep a higher percentage of their workforces employed.

County by County


Beaver County


  • Prior to the COVID-19 pandemic, Beaver County averaged 2 unemployment claims per week compared to 16 new claims afterward, an increase of 834%.
  • Because of its relatively small share of hard-hit tourism-dependent employment and higher-than-average share of lightly-hit covered agricultural employment, Beaver County has shown a smaller increase in claims due to the pandemic.
  • New claims as a percent of covered employment measured just 4% — one of the lowest rates in the state.
  • As in many other areas, accommodations/food services produced the highest number of new claims, with few claims in healthcare/social assistance.
  • Unusually, arts/entertainment/recreation also contributed a high number of new claims.
  • Beaver County accounted for 2% of the Southwest Region’s new claims prior to the pandemic, but only 1% of claims afterward.

Garfield County


  • Despite having the highest percentage of leisure/hospitality employment in the state, Garfield County ranked third for the percentage of initial claims filed as a share of covered employment (20%) after the COVID-19 pandemic hit. This is likely because many seasonal workers were already drawing unemployment insurance payments when the pandemic began.
  • Prior to the COVID-19 pandemic, Garfield County averaged six first-time claims per week, compared to an average of 53 claims per week afterwards. This change represents an increase of 856%.
  • Nearly 70% of claims were filed from workers furloughed from the accommodations/food service industry. A large share of claims from the “unknown” industry category most likely originated from this industry as well.
  • Apart from retail trade, other industries contributed few new claims.
  • Seasonal claims from the colder months meant Garfield County’s initial claims actually accounted for a larger share (6%) of the Southwest Region’s figure before the pandemic than after (4%).

Iron County


  • In the weeks before the COVID-19 pandemic, Iron County averaged 16 initial claims per week. After the pandemic hit, an average of 236 claims were filed per week, marking an increase of 1,390%.
  • In Iron County, first-time claims during the pandemic measured 9% of covered employment. That places Iron County in the bottom half of a county-by-county ranking.
  • As in many counties, Iron County’s accommodations/food service industry accounted for the highest number of new claims during the COVID-19 slowdown.
  • Healthcare/social assistance and retail trade ranked second and third respectively for new claims.
  • First-time claims from the manufacturing spiked in late April.

Kane County


  • Despite having a high percentage of tourism-related employment, the county showed a middle-of-the-pack ranking for new claims as a share of covered employment (10%). As in Garfield County, many seasonal employees were already drawing unemployment benefits prior to the pandemic.
  • Prior to the COVID-19 pandemic, Kane County averaged a nominal two first-time claims per week compared with 44 claims after the pandemic struck. This increase of 1,708% ranked as the largest in the region.
  • Accommodations/food services, retail trade and arts/entertainment/recreation generated the highest number of initial claims during the pandemic.
  • Roughly 44% of Kane County’s post-directive initial claims originated in the accommodations/food services industry.
  • Kane County’s regional share of new claims held steady before and during the COVID-19 pandemic.

Washington County


  • Not surprisingly, the county with the largest employment in southwest Utah also generated the largest number of COVID-19-related first-time claims. However, its share of claims increased from 69% prior to the pandemic to 74% during.
  • Before the COVID-19 pandemic, an average of 56 initial claims were being filed in Washington County compared to an average of 994 claims in the following weeks. The pre-to-post-pandemic increase registered 1,668%
  • Initial claims for unemployment benefits filed during the pandemic as a percent of covered employment measured 11%, near the middle of a ranking of all Utah counties.
  • Although it has a higher-than-average share of employment in accommodations/food services industry, Washington County’s economy is more diverse than many less-populated counties in the state. This industry’s share of claims in Washington County measured only 19% compared to 69% in Garfield County and 44% in Kane County.
  • Here too, accommodations/food services was the source of the largest number of new claims followed by retail trade, administration support/waste management/remediation (which includes temporary employment agencies) and healthcare/social assistance.
  • Claims originating from both manufacturing and transportation surged towards the end of the pandemic time period.

Tuesday, May 26, 2020

2019 City Population Estimates Now Available


Monday, April 20, 2020

Health Insurance In the Time of COVID-19

U.S. Census Bureau releases new 2018 Small Area Health Insurance Estimates

By Lecia Parks Langston, Senior Economist
 
“Americans want jobs. They want affordable health insurance. They want an education.” John McCain
 
 
As the world hunkers down under the effects of a pandemic, the need for health insurance coverage becomes even more apparent than usual. Just how many Utahns are covered by health insurance? Who are the uninsured? Data just released by the U.S. Census Bureau (2018 Small Area Health Insurance Estimates (SAHIE)) provides enlightenment on healthcare coverage in the under-65-year-old population. Additional demographic information is available from the American Community Survey, rounding out our understanding of the insured and uninsured in Utah.
 

Small Area Estimates

The SAHIE estimates cover the population under 65 years of age. Of course, virtually all citizens 65 and older are covered by government-provided Medicare benefits. Because these estimates date back to 2008, two years before the signing of the Affordable Care Act (ACA), they suggest the how the ACA has changed the health-insurance landscape in Utah.
 
 
Compared to other counties across the United States, Utah’s counties, for the most part, had mid-level to high levels of insured individuals in 2018 (the most recent data available). National regions of high coverage include northern eastern states and the west coast. Texas seems to have the highest uninsured levels with a vast number of counties experiencing uninsured rates of greater than 20%. Most Utah counties have uninsured shares below 15%.
 
In 2018, Morgan, Davis, Daggett and Emery counties showed the highest insured rates in Utah. In contrast, San Juan, Duchesne, Uintah, Piute and Garfield experienced the lowest rates of health insurance coverage.


That was then, this is now

The number and share of Utahns covered by health insurance have certainly improved in the past 10 years. In 2008, roughly 83.7% of the under-65 population was insured compared to about 89.6% in 2018, an increase of nearly 6 percentage points. In terms of individuals, that increase represents a gain of 427,000 insured Utahns.
 
However, coverage appears to have peaked in 2016 at 90.3% and has since retrenched. The repeal of ACA’s individual mandate and price increases, due to the elimination of cost-sharing reductions to payers selling individual plans, likely contributed to the recent slight decline in Utah coverage. However, the state’s Medicaid expansion, effective in 2020, should help bump up insured rates.

Less-populated counties, with initial low insured rates, experienced the strongest gains in insured shares. Daggett, Rich, Grand, Kane and San Juan counties displayed gains of roughly 10-points or higher. While all counties showed an improvement in the insured share of the under-65-year population, Salt Lake, Carbon, Summit and Millard counties experienced the smallest gains.
 

Highlights from the American Community Survey (2014-2018)

  • Roughly 58% of Utahns (of all ages) are insured in full or in part by employer-provided plans. Only 9% directly purchase their entire insurance coverage from a private provider. In total, nearly 70% of the state’s citizens have private coverage.
  • In total, public plans (Medicare and Medicaid) cover roughly 12% of Utah’s population. About 7% of the population is covered by Medicaid with another 3% covered by just Medicare. Roughly 1% of Utahns have coverage under both Medicare and Medicaid.
  • Those with a combination of public and private coverage account for another 9% of Utah’s population. That group includes 4% of Utahns who carry Medicare plus a supplemental source of private insurance. On the other hand, 10% have no healthcare insurance at all.
  • The very young and the very old are most likely to carry health insurance. Thanks to Medicare, individuals 65 years and older are the most likely to be covered (99%). On the other end of the spectrum, children under 6 years old displayed a coverage rate of 94%, with 6-18 year olds not far behind (92%).
  • Individuals between the ages of 26 and 34 are the least likely to have health insurance. Only 84% are covered in Utah.
  • By gender, females (91%) are just slightly more likely than males (89%) to maintain health insurance. This may be partially due to the dominance of women in the highly-covered 65-years-and-older group.
  • Education shows a high correlation with health insurance coverage. Persons with a bachelor’s degree or higher show the highest coverage rate — 96%. On the other end of the scale, individuals who did not graduate from high school maintained an insured rate of just 68%.
  • Not surprisingly, of all labor force statuses, the unemployed are least likely to have health insurance (65%). Interestingly, those not in the labor force (which would include the retired), display an insured rate just slightly lower than the employed. In addition, based on work experience, individuals working full-time, year-round are the most likely group be insured.
  • Household income is also a good predictor of health insurance coverage. Those with the highest incomes ($100,000 and over) have the highest coverage rates (95%). In contrast, those with the lowest incomes (under $25,000) have the lowest coverage rates (81%). a
  • Latino and Native Americans show the lowest rates of any major ethnic/racial groups. Rates for both sets measure just 73%. White, non-Latino Utahns maintain the highest health insurance coverage shares.
  • Only 56% of noncitizens have health insurance in Utah compared to 92 percent of Utahns born in the United States.

Tuesday, April 7, 2020

The U.S. Census Bureau Releases County Population Estimates for 2019

Next year, actual counts from the decennial census will be available

By Lecia Parks Langston, Senior Economist
“Any time you have population growth, there are business opportunities.” Roland Dorson
 
Hopefully, all Utahns are taking a break from COVID-19 concerns to respond (by phone, online or by mail) to their 2020 Census questionnaires (https://2020census.gov/). Since the Census results help determine how billions of dollars in federal funding are spent, accurate counts are important in order for Utah’s communities to get their “fair share.”
 
Because the actual counts are not yet available, the U.S. Census Bureau has just released the last set of population estimates for the decade. What do they show?


  • Iron County took the lead in population growth rates for 2019 — up by 4.1%. Following close behind was its neighbor, Washington County, with a growth rate of 3.5%.
  • Other fast-growing areas included counties at the edge of urban spread, such as Juab, Tooele and Wasatch.
  • Although Piute County saw an increase of only about 30 individuals, its small base population also resulted in a strong percentage increase (2.9%).
  • Utah County showed the highest percentage increase (2.4%) of the big-four Wasatch Front counties.
  • Estimates for both San Juan and Daggett counties suggested a decline in population, while Duchesne County’s population appeared to hold steady.
  • Utah County experienced the largest numeric gain in population — nearly 15,000 residents, followed by Salt Lake County (up about 12,000) and Washington County (up nearly 6,000).
  • Utah and Washington counties finished neck-and-neck in the race for net in-migration. Utah County’s net in-migration measured 5,200 compared to 5,100 for Washington County.
  • Several counties displayed net out-migration. Most notable on the list were Duchesne and San Juan counties. Daggett, Emery and Summit counties showed lesser out-migration estimates.
  • For its size, Utah County shows a relatively high number of births and a low number of deaths, placing its natural increase not far behind population-dense Salt Lake County.
  • Although Washington and Cache counties showed roughly equivalent numbers of births, deaths in Washington County measured much higher.
  • In 2019, Emery County experienced its first (albeit small) population growth in more than a decade.
  • Morgan County’s 2019 growth rate slipped below the state average for the first time this decade.
  • Wayne County saw its best population growth (1.5%) of the past 10 years in 2019.
  • Between 2010 and 2019, Wasatch County was the third fastest growing county in the nation. Washington County (St George, UT MSA) was the fifth fastest growing metropolitan area in the United States between 2010 and 2019. Its relatively small size contributes mathematically to a high growth rate. The Provo-Orem, UT MSA ranked ninth.
These aren’t the only estimates in town. The Kem C. Gardner Policy Institute at the University of Utah has assembled the Utah Population Committee (UPC) to reinstitute the population-estimates work previously conducted by the Utah Population Estimates Committee (UPEC). These estimates can be found here.
U.S. Census Bureau estimates use the same methodology in producing population figures for every county in the nation. Therefore, for nationwide comparisons, U.S. Census Bureau estimates may have the advantage. On the other hand, UPC population estimates have the benefit of local-analyst expertise and additional data sources.

Monday, December 23, 2019

Residential tenants begin moving into Joule Plaza in downtown St. George

After years in the making, residential tenants have begun to move into the $34 million Joule Plaza project with commercial tenants not far behind. There is the potential for the project to add 200 to 400 residents to the downtown area. Along with part-time and full-time residents, Joule Plaza is expected to attract rentals from tourists. Joule Plaza features more than 19,000 square feet of commercial space as well as residential units that range from studio apartments to one and two-bedroom accommodations. St. George News

SunTran service to roll into Washington City

The Washington City Council unanimously approved an interlocal agreement with St. George to expand SunTran bus service into the city’s downtown area. If all goes as planned, SunTran will be rolling through Washington City by summer 2021 at the latest.


Following discussion between county and municipal officials, the Washington County Commission chose to adopt a 0.25% sales tax in June. The county plans to use a portion of the sales tax revenue for a proposed St. George to Springdale transit route. St. George News

Washington County building gets $1.5 million facelift

The Washington County administrative building off St. George Boulevard recently got a facelift, with about a $1.5 million price tag. The building got new roofing, stucco, additional windows and other exterior work done the last six months. The revamping of this building is the first phase of several in updating and remodeling county buildings – which some parts of the buildings date back to 1966.


Construction began June 17, with MRW Design heading the project's architectural plans. Felshaw said Watts Construction Inc. was ahead of schedule for the most part throughout the last six months. Eventually, the interior of the building will be remodeled.


A request for quotes has been sent out to build a new administrative building on Tabernacle Street. This next year will be spent securing an architect and contractor, and the county hopes to break ground by the end of 2020 on a new building. The Spectrum

Proposed RV park outside Zion National Park rejected

A proposal to build an RV park, hotel and gas station near the northwest entrance to Zion National Park has been rejected by county commissioners who said the rural area wasn’t equipped to handle that kind of commercial development.


A company called Juniper Investors was asking the commission to rezone land near the town of New Harmony, Washington County, off Interstate 15. The area is near an entrance to Zion National Park that leads to a 5-mile scenic drive through the Kolob Canyons area. The park’s main entrance is southwest of there, about a 40-mile drive by highway to the town of Springdale, which already has dozens of hotels, restaurants, and outfitter and souvenir shops.


Park officials opposed the project because they worried the development would affect views from the canyon and overwhelm the limited staff that work the entrance. Deseret News

Dixie State University breaks ground on new Science, Engineering and Technology building

Dixie State University has started construction on a new Science, Engineering and Technology (SET) building. Earlier this year, the Utah Legislature appropriated $50 million worth of funds to the university for the SET building and an additional $4.4 million toward the completion of the Human Performance Center. The SET building is expected to be complete for the fall 2021 semester. The facility will be a total of 120,000-square-foot and is being created by Jacobsen Construction and VCBO Architecture. The building will include 26 laboratories, three levels of outdoor patios, classrooms and an astronomy deck. St George News