By Lecia Parks Langston, Senior Economist
“Farming looks mighty easy when your plow is a pencil and you’re a thousand miles from the corn field.”
Dwight D. Eisenhower
With all our talk of “nonfarm” jobs, you may think the Department of Workforce Services’ economists are agricultural employment bigots, always ignoring this important part of the economy. Au contraire. Trust me, we would love to share frequent agricultural employment updates, if only they were available. This is particularly true since we understand the important role of agriculture in Southwest Utah. However, the laws that provide the administrative data we use to track nonfarm employment cover only a portion of the agricultural work occurring in Utah.
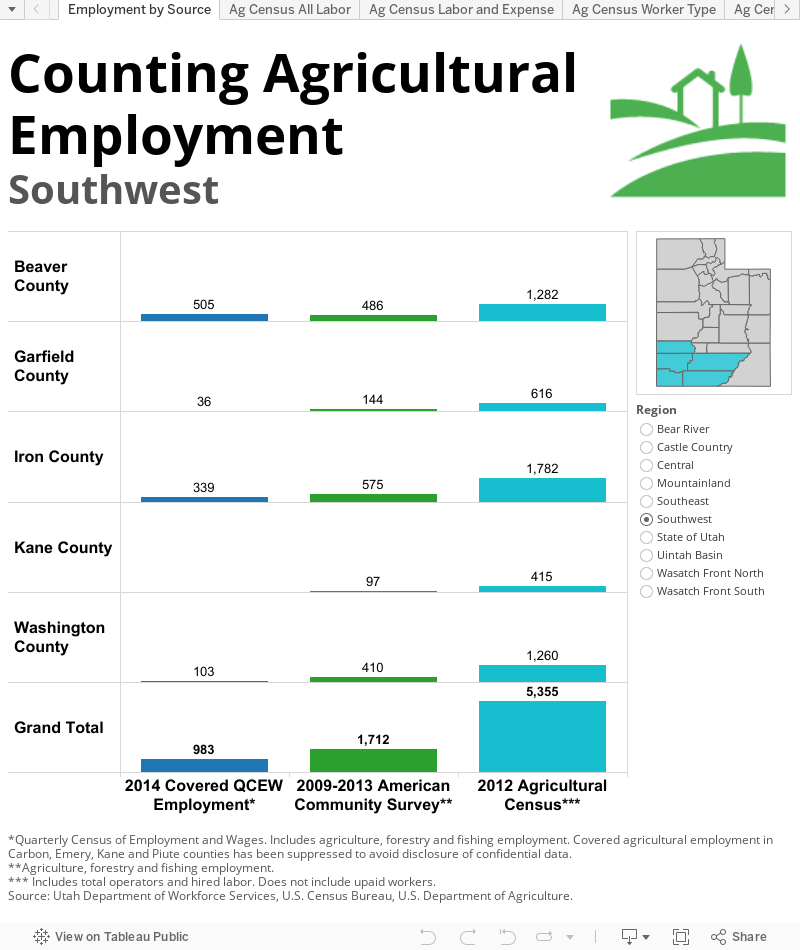
There are three primary sources of agricultural employment data; the Quarterly Census of Employment and Wages (QCEW, our usual “jobs” data), the American Community Survey (ACS) and the Census of Agriculture. As you can see from the data visualization, each yields a vastly different count of farm workers due to differences in coverage and methodology. The chart that follows this post outlines the differences. Here are some of the major variances:
• The Census of Agriculture is just that — a census. The ACS is a survey. The QCEW data is obtained from data collected as a byproduct of the administration of the unemployment insurance (UI) system, yet there are many small farming activities not subject to the UI laws.
• QCEW and the agricultural census count jobs as opposed to the ACS, which counts people in their primary industry. (One person can have several jobs.) • QCEW omits self-employed and firms with few/intermittent employees. It is the least inclusive of the agricultural employment counts.
• The agricultural census seeks to include all those who work in agriculture, whether for a whole year or a day. It is the most inclusive of the agricultural employment counts.
What count should you use?
As with most data, usage should be determined by purpose. As indicated, some sources are more inclusive that others.
In several Southwest Utah counties, agriculture can be big business and tracking QCEW agricultural employment adds to our understanding of the current economy. This agricultural employment, by definition, is not included in the “nonfarm” employment total that is typically the best economic indicator at the county level.
Counts from the ACS provide a sense of the workforce that has a principal attachment to farming and agriculture. On the other hand, the agricultural census attempts to capture almost everyone who works in agriculture (sometimes more than once, as it counts jobs, not people).
Comparing the numbers
In the five counties that comprise Southwest Utah, counts of agricultural employment range from just under 1,000 for covered QCEW jobs to more than 5,300 from the agricultural census. The ACS, which provides the best count of primary agricultural workers, chimes in with a count of 1,700 individuals. Not included in the agricultural census totals are substantial numbers of unpaid (usually family) workers. Large farms and agricultural establishments play an important role in the economies of both Beaver and Iron counties as evidenced by the relatively small difference between QCEW and ACS counts.
In fact, Beaver County’s largest employer is the Smithfield Hog Production facility (formerly Circle Four Farms). The county also maintains the third largest number of covered agricultural workers in the state and shows the highest percentage (a whopping 18 percent) of agricultural workers as a percentage of total QCEW employment. In Beaver County, average monthly wages in agriculture actually measure 112 percent of the average for all jobs. ACS data also demonstrate the importance of farming to this county’s economy. More than 18 percent of the civilian labor force has a primary job in agriculture.
While agribusiness is important in Iron County, only 2 percent of QCEW covered employment registers in agriculture, while 3 percent of the civilian labor force shows a primary job in the industry. As in Beaver County, agricultural workers covered under unemployment insurance laws exhibit higher-than-average monthly wages.
Garfield, Kane and Washington counties display smaller numbers of agricultural workers from every source. In Garfield and Kane counties, the small number of covered QCEW workers compared to ACS employment suggests that most farms are small, family-owned properties. In addition, while its counts may be relatively small, the ACS indicates that 6 percent of the Garfield County labor force and 3 percent of the Kane County labor force is primarily engaged in agriculture. Although Washington County shows more than 400 ACS agricultural workers, because of the county’s large labor market, they account for less than 1 percent of the labor force.
Delving into the labor data in the agricultural census
The agricultural census provides a wealth of information about agricultural labor not available from the other two sources. A few interesting facts follow. To explore more data, use the tabs on the visualization.
• In Garfield, Kane and Washington counties, unpaid workers outnumbered hired workers.
• In Southwest Utah, Iron County shows the highest number of operators and hired labor, but Beaver County’s total labor expense is far higher.
• Only Beaver and Iron counties showed an increase in operators between 2007 and 2012.
• Workers in Beaver and Iron counties, with their strong agribusiness presence, were more likely to work 150 days or more in a year.
• Only in Beaver County were farm operators more likely to have their primary occupation be farming than not. • Between 2002 and 2012, the average age of farm operators has steadily increased.
 |
| Click to Enlarge |