New Occupational Projections Available
Mark Knold, Supervising Economist“The government knows everything about everyone.”
Fortunately, that statement is not true. Yet society still looks to the government to provide answers to comprehensive and complex questions that have their foundation within individual decisions and activities. One subject frequently directed toward the government is individual-level information about the economy — particularly, what occupations are in demand, what occupations pay well and have lucrative outlooks, and ultimately, what occupation(s) should I build my career upon?
It takes the accumulation of a wide array of individual information to answer these questions. Employers provide the foundation information about the occupations they employ. Jobs are held by individuals, but employers provide the profile information about the job itself, not any particular individual.
Since society desires to profile such a broad spectrum of the economy — occupational profiles and the occupational distribution within the economy — only government is in the unique position to collect, analyze and provide answers for said desire. Yet, no government program or regulatory agency mandates any comprehensive occupational reporting from individuals or businesses. Therefore, government attempts to fill the void with an ongoing, robust and voluntary survey of employers — a survey where employers are asked to provide details about their various occupations, including descriptions, quantities, wages/salaries and location. Through this survey emerges an occupational portrait of an economy.
The U.S. Bureau of Labor Statistics (BLS) structures and funds the survey, yet the individual states conduct the survey. Under BLS administration, all states use the same methodology; therefore, occupational profiles are comparable across states.
Through this survey, analysts discover how industries are populated with various occupations. Accountant is an occupation, yet accountants can be found across many different industries. Other occupations may be more exclusive to certain industries; for example, doctors are largely found only in the healthcare industry. One of the survey’s products is that industries can be profiled with their general mix of occupations. This is called an industry’s occupational staffing pattern.
This brings us back to the original questions: what occupations are in demand, what occupations pay well and have lucrative outlooks, and ultimately, what occupation(s) should I build my career upon? The foundation is to make informed forecasts about how industries will expand/contract over the next 10 years. By applying existing occupational staffing patterns to each industry’s projected change, a trained economic analyst can then make an extrapolation about how occupations will correspondingly increase/decrease. Knowledgeable analyst judgment further refines the occupational expectations, such as knowing an occupation will grow faster than in the past, with the result being a set of occupational projections that accumulate to profile a state or regional economy.
A new set of occupational projections are done every two years to keep the information fresh even though economies do not change dramatically in short order. Because of slow change, updated occupational projects generally continue the overall message of preceding occupational projections. But economies do modify with time, and therefore, subtle changes will arise with each new set of occupational projections.
Utah’s most recent occupational projections are found here: http://www.jobs.utah.gov/wi/pubs/outlooks/state/index.html. These projections look forward to the year 2024.
The occupational profile is structured from the general to the detailed, mimicking the structure of a family tree. First, broad occupational categories are defined, such as management or healthcare occupations; then, subcategories are defined; and finally, individual occupations are defined. Individual occupations are the heart of the occupational projections. But overall patterns and characteristics do emerge when observing the broader categories.
While a Utah statewide profile leads the way, Utah’s local economies are not homogenous; therefore, nine Utah subregions are also profiled. Due to confidentiality restraints and statistical reliability, the amount of occupations available will diminish the smaller a subregion; but, occupations comprising the backbone of a regional economy will be available.
Washington County and the Southwest Region
Lecia Parks Langston, Senior Economist
Due to its status as a Metropolitan Statistical Area, Washington County gets its own set of survey-supported occupational projections. We also prepare a job outlook as a group for the remaining four counties in Southwest Utah (Beaver, Garfield, Iron and Kane).
Washington County
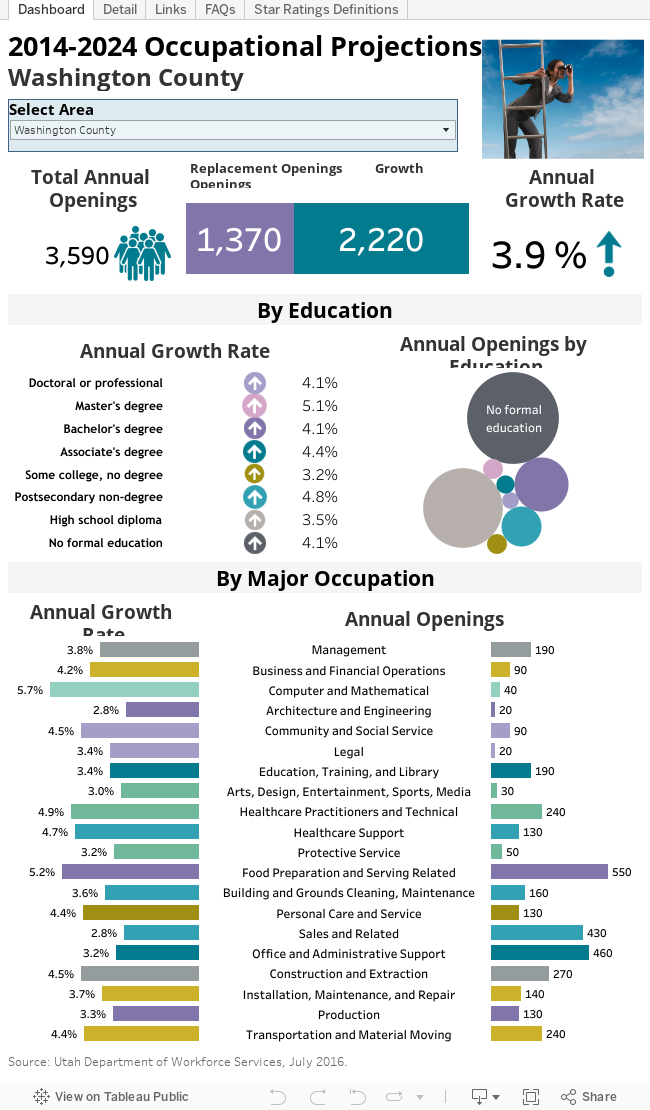
Washington County takes top honors as the projected fastest-growing area in the state. Between 2014 and 2024, Washington County employment is expected to expand at an annual average rate of 3.9 percent, notably higher than the statewide average of 2.7 percent. That expansion should result in almost 3,600 job openings a year. Growth plays a major role in future openings with 62 percent occurring from business expansion. Replacement needs constitute the remaining 38 percent of openings. Statewide, only 54 percent of new openings are expected to arise from growth.
With its large employment base and high replacement needs, food preparation and serving occupations are projected to create the highest number of Washington County openings. Likewise, the large employment groups of office and administrative support (e.g., clerical) and sales occupations should also generate large numbers of positions.
On the other hand, the smaller computer/mathematical occupational group, with an annual average growth rate of 5.7 percent, is expected to show the most rapid expansion. Nevertheless, food preparation and serving jobs aren’t far behind, with a 5.2-percent annual rate of increase. In addition, both the healthcare practitioners/technical (4.9 percent) and healthcare support (4.7 percent) groups should see strong expansion as well.
Not surprisingly, occupational groups with current low levels of employment are also expected to add fewer jobs to the economy than their much large peers. In Washington County, architecture/engineering and legal occupations will supply the smallest number of openings. The slowest growth rates are expected for architecture/engineering and sales. However, even these occupational groups show faster growth rates than the statewide average. Moreover, openings for sales occupations are high due to the large size of the occupational group and its high replacement status.
Because many jobs in the Washington County economy currently require little education and many of these positions also have high replacement needs, jobs requiring a high school education or less are expected to account for more than 70 percent of total openings between 2014 and 2024. However, in general, jobs requiring more education are expected to expand at a faster-than-average rate.
The individual occupations adding the highest number of openings usually belong to the major occupational groups providing the highest number of openings. In Washington County, fast food workers, retail salespersons and waiters/waitresses are expected to add the highest number of new openings. These are typically lower-paying positions. However, not all high-opening occupations in Washington County are considered low paying. General/operations managers and registered nurses are among the occupations with the highest volume of projected openings.
In an attempt to help provide career guidance, the Department of Workforce Services has attached star ratings to most occupations. These ratings take into account both employment outlook (openings and growth rate) and wages. Among occupations with the best five-star rating, 70 percent of projected openings typically require a bachelor’s degree or higher. For more information about star ratings and detailed occupational information, see the links in the data visualization.
The Other Southwest Counties
In contrast to Washington County, the remaining Southwest Utah counties are projected to grow at a slower annual average rate of 2.0 percent, notably below the statewide average of 2.7 percent. Slower projected expansion is not uncommon among Utah’s less-populated regions. Southwest Utah should generate almost 1,200 job openings each year between 2014 and 2024. Replacement needs are expected to outpace growth somewhat, providing 55 percent of total openings.
In a pattern similar to Washington County, food preparation/serving, office/administrative support (e.g., clerical) and sales occupations are expected to provide the largest number of openings over the 10-year period. These occupational groups also maintain the highest levels of current employment.
However, when it comes to growth rates, the four Southwest Utah counties diverge from Washington County. In Southwest Utah, the fastest growing occupational group is expected to be construction and extraction, with an annual average expansion rate of 3.7 percent. Nevertheless, both healthcare practitioners and healthcare support (2.6 percent and 3.0 percent respectively) show up among the fastest growing occupational clusters. Iron County’s heavy manufacturing presence is also reflected in strong (2.6 percent) expansion in production occupations.
Occupational groups projected to provide few openings in Southwest Utah include computer/mathematical and architecture/engineering occupations. Life/physical/social science positions are expected to decline slightly (although replacement needs will still generate openings). Despite contributing many job openings, sales and administrative support occupations are expected to show some of the lowest growth rates along with protective services.
Like the statewide profile, jobs with the highest current employment tend to require less education. Their large employment base coupled with high replacement needs means roughly 82 percent of employment openings between 2014 and 2024 in Southwest Utah are expected to require a high school degree or less. While growth rates by educational requirements fall in a fairly tight range, jobs typically requiring a postsecondary non-degree award should show the fastest growth while providing relatively few openings.
As in Washington County, individual occupations in Southwest Utah projected to generate the largest number of openings are generally categorized in the occupational groups with the highest current employment. Cashiers, fast food workers, retail salespersons and waiters/waitresses are expected to show the highest number of openings in Southwest Utah. Of course, many of these positions pay lower-than-average wages. However, general/operations managers and carpenters will also provide a high level of openings.
In Southwest Utah, five-star jobs with the best employment outlook and wages run the gamut from supervisors and managers to truck drivers and accountants. For more information about star ratings detailed occupational projections, remember to check out the links in the data visualization.