Showing posts with label Commuting. Show all posts

Thursday, April 21, 2016

Your area’s labor market information is “OnTheMap”

The Census Bureau’s online mapping tool provides a wealth of location-specific labor market information 

By Lecia Parks Langston, Senior Economist

 “If you want to put yourself on the map, publish your own map.” Ashleigh Brilliant

This isn’t your same old blog post about data. Instead of analyzing and sharing data, this post covers how to access an extremely useful “big data” labor market information tool. What is this tool? The U.S. Census Bureau’s OnTheMap web-based mapping and reporting application.

What’s so great about OnTheMap? Typically, we report labor market information at the state and county level. Local-level data is harder to come by. Along with the ability to provide labor market profiles of small and large nonstandard areas, OnTheMap graphically demonstrates where people work and where workers live. Users can define their own geographies and obtain data and maps at the census-block level of detail. This flexibility can quickly provide information for emergency and transportation planning, site location and economic development.

Do you want to understand commuting patterns for a particular area? OnTheMap can generate maps of outflow and inflow. Do you want to know the basic characteristics of workers in your town? OnTheMap has that information. Do you want to identify the employment characteristics along a specific stretch of highway? OnTheMap can deliver that data. Do you want to discern how many workers live within a 50-mile radius of a particular site? OnTheMap delivers.

Where does this data come from? OnTheMap combines federal and state administrative data on workers and employees with Census Bureau census and survey data. Don’t worry. Using state-of-the-art methods, the Census Bureau is committed to protecting the confidentiality of business and personal information.

Where People Work 

Let’s run through a few examples of how OnTheMap outputs can help you understand your local economy. Suppose the Enoch City Council wants to know where the residents of their town work. OnTheMap indicates almost half of the city’s working residents are employed in Cedar City.


Next, the Mayor wants to know how many workers travel into Enoch for employment. OnTheMap suggests that far fewer workers commute in than out of Enoch. In-commuters are most likely to drive from Cedar City.


Labor Market Characteristics

Now, these local government officials have decided they would like to know the characteristics of those folks that work or live in Enoch. OnTheMap can provide age-group, earnings, industry, race/ethnicity, gender and educational attainment information. For example, OnTheMap shows the following characteristics for working residents of Enoch:

• One-fourth are 29 years or younger
• 32 percent make more than $3,333 a month
• 10 percent work in manufacturing
• 93 are Latino
• 18 percent have at least a Bachelor’s degree
• 45 percent are female

Getting Specific 

A company thinking of locating to Enoch, is interested in the number (and characteristics) of workers within a standard commuting distance of a particular worksite. Economic development professionals can specify a particular radius and obtain a report. Other shapes (donut and plume) are also available. In addition, users can draw their own polygons in OnTheMap. To determine how many workers may be inconvenienced by a road construction project, just draw a line along the length of the project and “buffer” the selection.


You should begin to see what a valuable informational tool OnTheMap can be for planning and economic development purposes. OnTheMap is available here.

Monday, August 26, 2013

Ivins officials OK SunTran route

Click to Enlarge
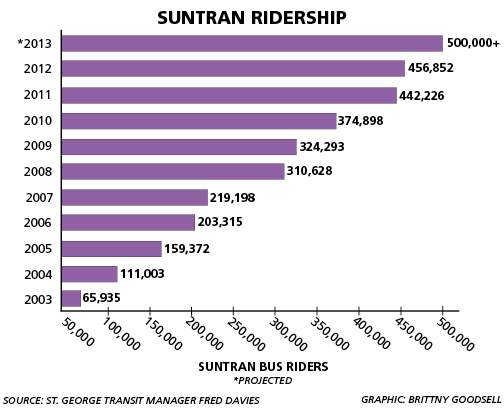
Ivins’ council voted unanimously to provide funds to match a federal grant for the cost of establishing a bus line that will connect riders from SunTran’s Sunset Boulevard station to the Tuacahn complex, the Veterans Home care center, medical offices and downtown residences. The remaining 80 percent of the costs will be funded by federal grants, and St. George will provide administrative services for the bus system. St. George approved its part of the agreement in June. It will be early 2015 before the public transportation route to begin. The Spectrum

 Note: According to the American Community Survey, only 0.4 percent of Washington County’s workers use public transportation to get to work. Another 4.4 percent work at home. On average, Washington County workers spend 17.5 minutes traveling to their employment—far lower the 25.5-minute U.S. average.

Thursday, July 11, 2013

Part Duex. . .Heigh Ho, Heigh Ho, It’s Off to Work We Go by City

Last week we posted a visualization depicting recently released commuter-adjusted county population estimates from the U.S. Census Bureau. (Click here to see the original post.) This visualization shows similar information for Utah’s cities with 5,000 or more population.

  • Cities experiencing the highest percentage increase in daytime population due to in-commuting include Park City (where population increases by almost half during the day), Salt Lake City, South Salt Lake, Vernal, and Lindon.
  • On the other side of the scale, Summit Park, West Point, Stansbury Park, Kearns and Hooper show the largest shrinkage in workday population.
  • In terms of sheer numbers, Salt Lake City, South Salt Lake, Ogden, Murray and St. George see the largest numeric influx in workers during the day.
  • The bedroom communities of West Jordan, Kearns, Taylorsville, Roy and Millcreek experience the greatest population shrinkage during the day. 

To access all the Census Bureau tables on commuter-adjusted population, click here.


Wednesday, July 3, 2013

Heigh Ho, Heigh Ho, It’s Off to Work We Go. . .

For most of us, commuting to work is a fact of life. For many, that commute includes crossing state, county, or city boundaries. To aid local planners and others in understanding the difference between day and night populations, the U.S. Census Bureau has just released commuter-adjusted population estimates from the American Community Survey.

Remember that the difference in workday and nonworking day populations will be affected by three factors: the number of workers who are employed within their county of residence, the number of workers who commute outside the county, and finally, the number of workers who commute to the county from homes in other areas. Conceptually, even though significant commuting can occur, out-commuting could equal in-commuting resulting in no change in the workday population.

You can use the visualization below to retrieve and examine these estimates. Later, we’ll add some city-level estimates.

  • Most Utah counties experience little difference in workday and non-workday populations. Summit, Salt Lake, and Grand counties show the largest percent change in daytime populations due to commuting. 
  • On the other hand, “bedroom” communities are more numerous. Counties with significant net out-commuting include Morgan (more than one-fifth of workers leave the county for employment), Tooele, Wasatch, Davis and Juab counties. 
  • In general, the most significant commuting occurs in and around the Wasatch Front. 
  • In terms of sheer numbers, Salt Lake County experiences the largest influx of net commuting. On a typical workday, the county’s daytime population swells by a whopping 69,000 individuals. 
  • Davis and Utah counties show the most significant net declines in population due to commuting—roughly 29,000 and 19,000 respectively.