Showing posts with label Garfield County. Show all posts

Monday, April 20, 2020

Health Insurance In the Time of COVID-19

U.S. Census Bureau releases new 2018 Small Area Health Insurance Estimates

By Lecia Parks Langston, Senior Economist
 
“Americans want jobs. They want affordable health insurance. They want an education.” John McCain
 
 
As the world hunkers down under the effects of a pandemic, the need for health insurance coverage becomes even more apparent than usual. Just how many Utahns are covered by health insurance? Who are the uninsured? Data just released by the U.S. Census Bureau (2018 Small Area Health Insurance Estimates (SAHIE)) provides enlightenment on healthcare coverage in the under-65-year-old population. Additional demographic information is available from the American Community Survey, rounding out our understanding of the insured and uninsured in Utah.
 

Small Area Estimates

The SAHIE estimates cover the population under 65 years of age. Of course, virtually all citizens 65 and older are covered by government-provided Medicare benefits. Because these estimates date back to 2008, two years before the signing of the Affordable Care Act (ACA), they suggest the how the ACA has changed the health-insurance landscape in Utah.
 
 
Compared to other counties across the United States, Utah’s counties, for the most part, had mid-level to high levels of insured individuals in 2018 (the most recent data available). National regions of high coverage include northern eastern states and the west coast. Texas seems to have the highest uninsured levels with a vast number of counties experiencing uninsured rates of greater than 20%. Most Utah counties have uninsured shares below 15%.
 
In 2018, Morgan, Davis, Daggett and Emery counties showed the highest insured rates in Utah. In contrast, San Juan, Duchesne, Uintah, Piute and Garfield experienced the lowest rates of health insurance coverage.


That was then, this is now

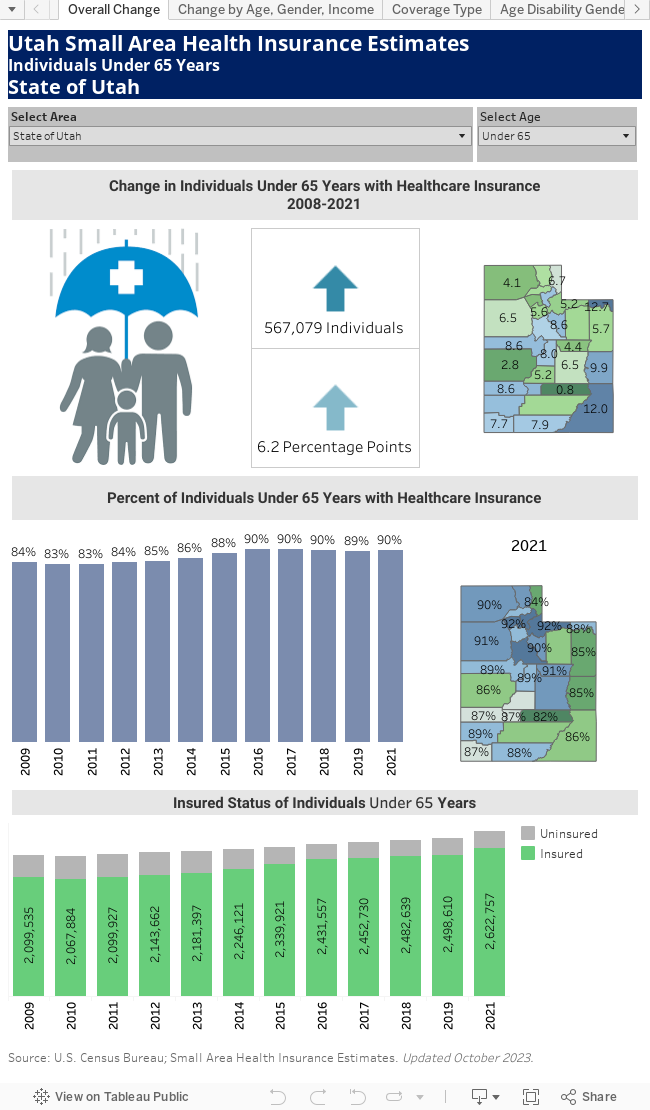
The number and share of Utahns covered by health insurance have certainly improved in the past 10 years. In 2008, roughly 83.7% of the under-65 population was insured compared to about 89.6% in 2018, an increase of nearly 6 percentage points. In terms of individuals, that increase represents a gain of 427,000 insured Utahns.
 
However, coverage appears to have peaked in 2016 at 90.3% and has since retrenched. The repeal of ACA’s individual mandate and price increases, due to the elimination of cost-sharing reductions to payers selling individual plans, likely contributed to the recent slight decline in Utah coverage. However, the state’s Medicaid expansion, effective in 2020, should help bump up insured rates.

Less-populated counties, with initial low insured rates, experienced the strongest gains in insured shares. Daggett, Rich, Grand, Kane and San Juan counties displayed gains of roughly 10-points or higher. While all counties showed an improvement in the insured share of the under-65-year population, Salt Lake, Carbon, Summit and Millard counties experienced the smallest gains.
 

Highlights from the American Community Survey (2014-2018)

  • Roughly 58% of Utahns (of all ages) are insured in full or in part by employer-provided plans. Only 9% directly purchase their entire insurance coverage from a private provider. In total, nearly 70% of the state’s citizens have private coverage.
  • In total, public plans (Medicare and Medicaid) cover roughly 12% of Utah’s population. About 7% of the population is covered by Medicaid with another 3% covered by just Medicare. Roughly 1% of Utahns have coverage under both Medicare and Medicaid.
  • Those with a combination of public and private coverage account for another 9% of Utah’s population. That group includes 4% of Utahns who carry Medicare plus a supplemental source of private insurance. On the other hand, 10% have no healthcare insurance at all.
  • The very young and the very old are most likely to carry health insurance. Thanks to Medicare, individuals 65 years and older are the most likely to be covered (99%). On the other end of the spectrum, children under 6 years old displayed a coverage rate of 94%, with 6-18 year olds not far behind (92%).
  • Individuals between the ages of 26 and 34 are the least likely to have health insurance. Only 84% are covered in Utah.
  • By gender, females (91%) are just slightly more likely than males (89%) to maintain health insurance. This may be partially due to the dominance of women in the highly-covered 65-years-and-older group.
  • Education shows a high correlation with health insurance coverage. Persons with a bachelor’s degree or higher show the highest coverage rate — 96%. On the other end of the scale, individuals who did not graduate from high school maintained an insured rate of just 68%.
  • Not surprisingly, of all labor force statuses, the unemployed are least likely to have health insurance (65%). Interestingly, those not in the labor force (which would include the retired), display an insured rate just slightly lower than the employed. In addition, based on work experience, individuals working full-time, year-round are the most likely group be insured.
  • Household income is also a good predictor of health insurance coverage. Those with the highest incomes ($100,000 and over) have the highest coverage rates (95%). In contrast, those with the lowest incomes (under $25,000) have the lowest coverage rates (81%). a
  • Latino and Native Americans show the lowest rates of any major ethnic/racial groups. Rates for both sets measure just 73%. White, non-Latino Utahns maintain the highest health insurance coverage shares.
  • Only 56% of noncitizens have health insurance in Utah compared to 92 percent of Utahns born in the United States.

Tuesday, April 7, 2020

The U.S. Census Bureau Releases County Population Estimates for 2019

Next year, actual counts from the decennial census will be available

By Lecia Parks Langston, Senior Economist
“Any time you have population growth, there are business opportunities.” Roland Dorson
 
Hopefully, all Utahns are taking a break from COVID-19 concerns to respond (by phone, online or by mail) to their 2020 Census questionnaires (https://2020census.gov/). Since the Census results help determine how billions of dollars in federal funding are spent, accurate counts are important in order for Utah’s communities to get their “fair share.”
 
Because the actual counts are not yet available, the U.S. Census Bureau has just released the last set of population estimates for the decade. What do they show?


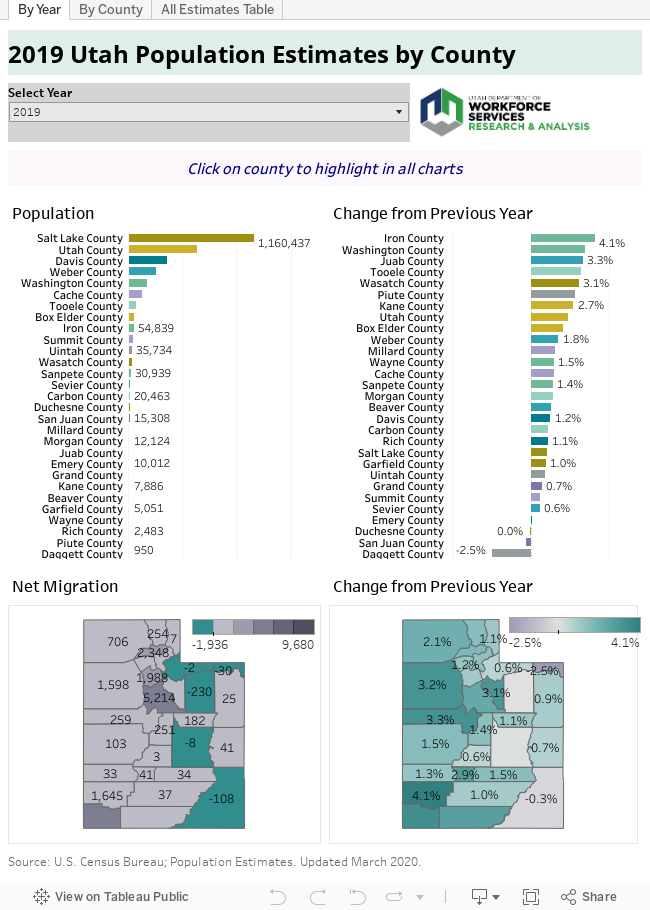
  • Iron County took the lead in population growth rates for 2019 — up by 4.1%. Following close behind was its neighbor, Washington County, with a growth rate of 3.5%.
  • Other fast-growing areas included counties at the edge of urban spread, such as Juab, Tooele and Wasatch.
  • Although Piute County saw an increase of only about 30 individuals, its small base population also resulted in a strong percentage increase (2.9%).
  • Utah County showed the highest percentage increase (2.4%) of the big-four Wasatch Front counties.
  • Estimates for both San Juan and Daggett counties suggested a decline in population, while Duchesne County’s population appeared to hold steady.
  • Utah County experienced the largest numeric gain in population — nearly 15,000 residents, followed by Salt Lake County (up about 12,000) and Washington County (up nearly 6,000).
  • Utah and Washington counties finished neck-and-neck in the race for net in-migration. Utah County’s net in-migration measured 5,200 compared to 5,100 for Washington County.
  • Several counties displayed net out-migration. Most notable on the list were Duchesne and San Juan counties. Daggett, Emery and Summit counties showed lesser out-migration estimates.
  • For its size, Utah County shows a relatively high number of births and a low number of deaths, placing its natural increase not far behind population-dense Salt Lake County.
  • Although Washington and Cache counties showed roughly equivalent numbers of births, deaths in Washington County measured much higher.
  • In 2019, Emery County experienced its first (albeit small) population growth in more than a decade.
  • Morgan County’s 2019 growth rate slipped below the state average for the first time this decade.
  • Wayne County saw its best population growth (1.5%) of the past 10 years in 2019.
  • Between 2010 and 2019, Wasatch County was the third fastest growing county in the nation. Washington County (St George, UT MSA) was the fifth fastest growing metropolitan area in the United States between 2010 and 2019. Its relatively small size contributes mathematically to a high growth rate. The Provo-Orem, UT MSA ranked ninth.
These aren’t the only estimates in town. The Kem C. Gardner Policy Institute at the University of Utah has assembled the Utah Population Committee (UPC) to reinstitute the population-estimates work previously conducted by the Utah Population Estimates Committee (UPEC). These estimates can be found here.
U.S. Census Bureau estimates use the same methodology in producing population figures for every county in the nation. Therefore, for nationwide comparisons, U.S. Census Bureau estimates may have the advantage. On the other hand, UPC population estimates have the benefit of local-analyst expertise and additional data sources.

Monday, December 23, 2019

Park Service OKs plan to reconstruct section of state Route 12 in Bryce Canyon

The National Park Service has approved a plan to reconstruct a section of state Route 12 that was damaged in a 2017 landslide. The project, between mileposts 14 and 18, will be implemented in three phases and is anticipated to begin next spring. According to the park service, the roadway footprint will be 51 feet wide with 5-foot bicycle lanes on either side and shoulders that are a foot wide. Between mileposts 14.6 and 15.8, the road will be widened to include three 12-foot travel lanes for a westbound passing lane extension. Deseret News

Thursday, March 28, 2019

Where Have All the Young Workers Gone?

Young workers in Utah and the U.S. comprise a smaller share of the labor force


By Lecia Parks Langston, Senior Economist
 
"We should be trying to reach the young workers because that’s when you’re most idealistic and have least fear."  John Lennon

 
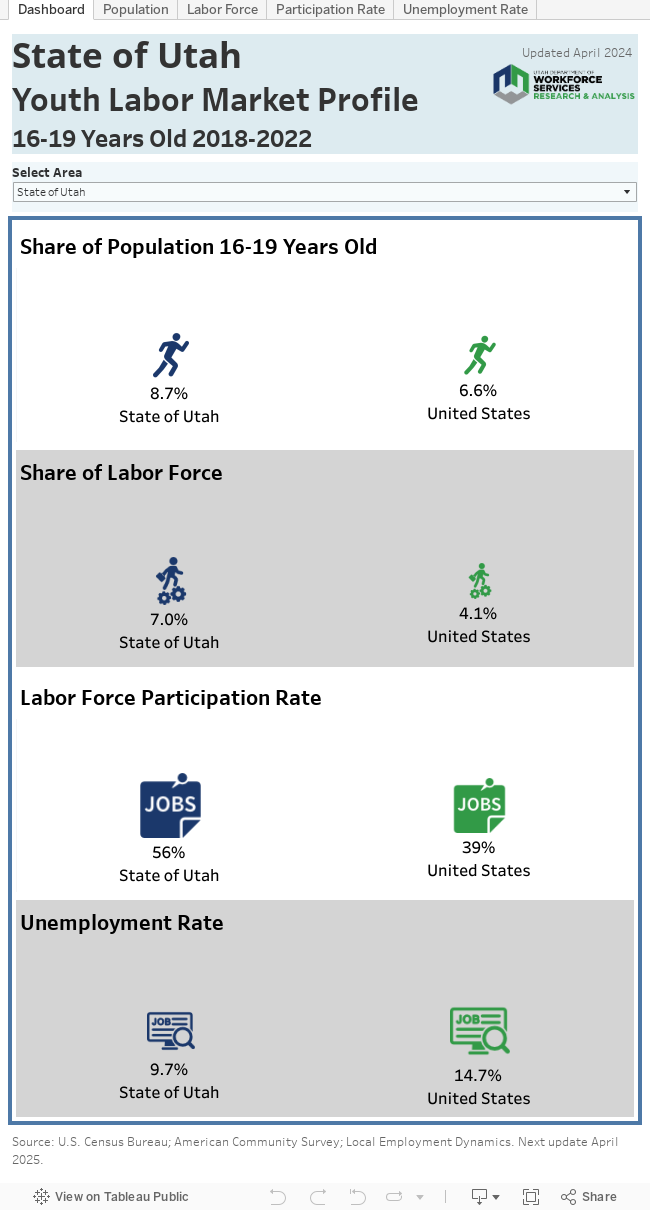
One of the most striking labor market changes of the last decade and a half is the declining participation of teenagers in the labor force. Nationally, teenage participation topped out at almost 59 percent in the late 1970s, and today stands at roughly 36 percent. While the trend isn’t as pronounced in Utah as it is nationwide; here, too, young people are less likely to be employed or looking for work than they were as the century began. The reasons for this phenomena are not clear. However, more after-school activities and increased borrowing to pay for post-secondary education (rather than earning while learning) may factor into this decline.
 
On the other hand, some characteristics of youth workers have changed little. Utah teens still show some of the highest labor force participation rates in the nation. Also, young people continue to show the highest unemployment rates, the lowest wages and the top turnover rates of any age group.
 

Monday, December 17, 2018

New GDP figures will add to the local economic-analysis tool box


New GDP figures will add to the local economic-analysis tool box

By Lecia Parks Langston, Senior Economist

“We will find neither national purpose nor personal satisfaction in a mere continuation of economic progress, in an endless amassing of worldly goods. We cannot measure national spirit by the Dow Jones Average, nor national achievement by the Gross National Product.”  Robert Kennedy
As a regional economist, I’m routinely asked for gross domestic product (GDP) figures for Utah’s counties. After all, nationally, GDP is routinely tracked as an economic indicator. “Sorry,” I say, “the Bureau of Economic Analysis (BEA) doesn’t produce GDP statistics for counties (unless they are a metropolitan statistical area). But data-lovers, “the times, they are a-changin’.”
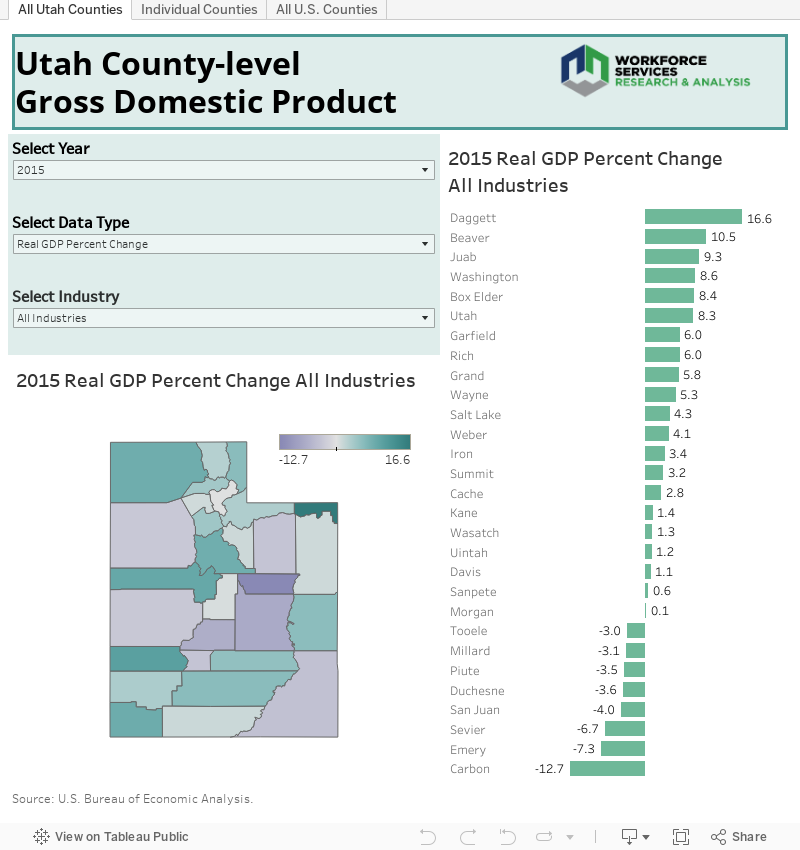
The U.S. Bureau of Economic Analysis has just released proto-type county GDP statistics for 2012 to 2015. You can explore the data in the visualization that follows.


Yes, the proto-type information is dated. However, data-users can take a first-look at the series and assist BEA by providing feedback and comments on the prototype data via e-mail at gdpbycounty@bea.gov. Official statistics are scheduled for release in December 2019.
When the official data is released, this new data will add to our ability to analyze Utah’s local economies.
What do the proto-type figures reveal? Here are a few highlights:
In 2015, eight Utah counties experienced a decline in GDP following a trend similar to 2013 and 2014.
  • Less-populated counties were most likely to experience a bout of declining GDP.
  • Daggett County, one of Utah’s smallest in both geographic size and population, showed the highest GDP growth rate in 2015 with Washington County showing the highest rate of expansion among more-populated counties.
  • It wasn’t uncommon for Utah counties to experience at least one year of GDP contraction between 2013 and 2015.
  • Not surprisingly, the vast majority of GDP is generated along the Wasatch Front.

Wednesday, September 26, 2018

State homeless report shows increase in ‘unsheltered’ individuals in Southern Utah

An annual overnight count of Utah’s homeless population in January shows the amount of individuals experiencing homelessness increased in Washington County and areas in and around Iron County, according to a report released last week. The overnight count of the state’s homeless, known as the point-in-time count, was conducted Jan. 24. The results were published Aug. 8 in a report from the Utah Department of Workforce Services.

Washington County experienced an increase of 98 unsheltered individuals this year over last, making for a total of 154, according to the report. The total number of both sheltered and unsheltered homeless individuals in Washington County is 245, according to the report, which is up from 2017’s count of 133.

For the area of Iron County – which also includes counts from Beaver, Garfield and Kane counties – the total amount of homeless individuals was 42, with 10 counted as unsheltered. This is an increase from 29 persons and no reported unsheltered in 2017. St George News

Monday, March 5, 2018

Utah's Seasonally Adjusted Unemployment Rates

Seasonally adjusted unemployment rates for all Utah counties have been posted online here.

Each month, these rates are posted the Monday following the Unemployment Rate Update for Utah.

For more information about seasonally adjusted rates, read a DWS analysis here.

Next update scheduled for March 26th.

Wednesday, February 14, 2018

Zion, Bryce Canyon both set new records for numbers of visitors in 2017

Utah's most popular national parks are only getting more popular, with both Zion and Bryce Canyon National Park reporting record numbers of visitors in 2017. Zion National Park saw more than 4.5 million visitors over the course of the year, a 5 percent increase over 2016, which had been the record year with 4.3 million visitors, according to figures published by the National Park Service. At Bryce Canyon, the figure was 2.6 million, a 9-percent increase over 2016, which was also the previous record holder at 2.4 million. Both parks have seen visitation grow by more than 40 percent since 2010, with steady increases in traffic each year. The Spectrum

Monday, January 29, 2018

Ten Years Later. . .

The Recovery Following the Great Recession


By Mark Knold, Supervising Economist and Lecia Parks Langston, Senior Economist

“The term 'business cycle' is imprecise. Economic fluctuations affect everyone, not just businesses, and they are, unlike astral cycles, anything but regular.” Kevin Hassett

Overview


December 2017 marked 10 years since the Great Recession first cast its long shadow across the American economy. The recession officially lasted 18 months, but its consequences can still be seen across the country without having to look very hard. We have not had another recession since.

Utah was hit hard at the time, losing a larger share of jobs than the national average; but, we were fortunate to be one of the most resilient states in terms of economic rebound. There are plenty of states where the Great Recession continues to weigh upon them. Employment levels in 14 states are still not back to their pre-recession peak, and another 29 states have only grown 5.0 percent or less. As the working-age population has grown by more than 5.0 percent, the job gains nationally have not been enough to fully employ working-age labor.

Utah lost 7.0 percent employment during the recession. Since that low, employment has recovered by 18 percent. That is the second best rebound in the nation. From Utah’s pre-recession employment peak to now, Utah’s employment has increased by 9.5 percent, third best in the nation. Yet, Utah’s job growth has not been enough to absorb all of the labor force growth during that time. Utah’s unemployment rate is low, but the percent of the working-age population in the labor force is several percentage points below the pre-recession norm — telling us that potential labor is still not as fully engaged with the job market as before the recession.

As a whole, Utah has had a notable recession rebound, but those gains have not been shared equally across all regions. Just like the national profile, some areas have bounced back strong while others are still lagging behind. The state’s metropolitan areas have grown well, but many of Utah’s rural areas cannot say the same. Nine counties have employment levels below their pre-recession peaks.

In this issue of Local Insights, we profile Utah’s regional and county economies in light of the 10-year span since the Great Recession.

Southwest Utah and the Recovery


The five counties in Southwest Utah — Beaver, Garfield, Iron, Kane and Washington — each experienced the Great Recession and the ensuing recovery in their own way. Unfortunately, this corner of Utah generally took longer to pull out of the downturn than did Utah or the nation.


Washington County


Washington County was an uninhibited participant in the housing bubble that was the precursor to the Great Recession. Not surprisingly, its crash was longer and deeper than other less-involved counties. For almost three years prior to the economic collapse, Washington County showed 10-percent job growth as construction industry employment exploded. In this case, what went up definitely came down. The worst job-loss month in Utah registered a 6.2-percent decline (year-to-year), while the nation’s worst comparable loss measured 5.0 percent. Washington County’s loss imitated its prerecession gains at 9.7 percent. Moreover, Washington County just kept losing jobs at this rate while the state and the nation bounced back.

Monday, December 4, 2017

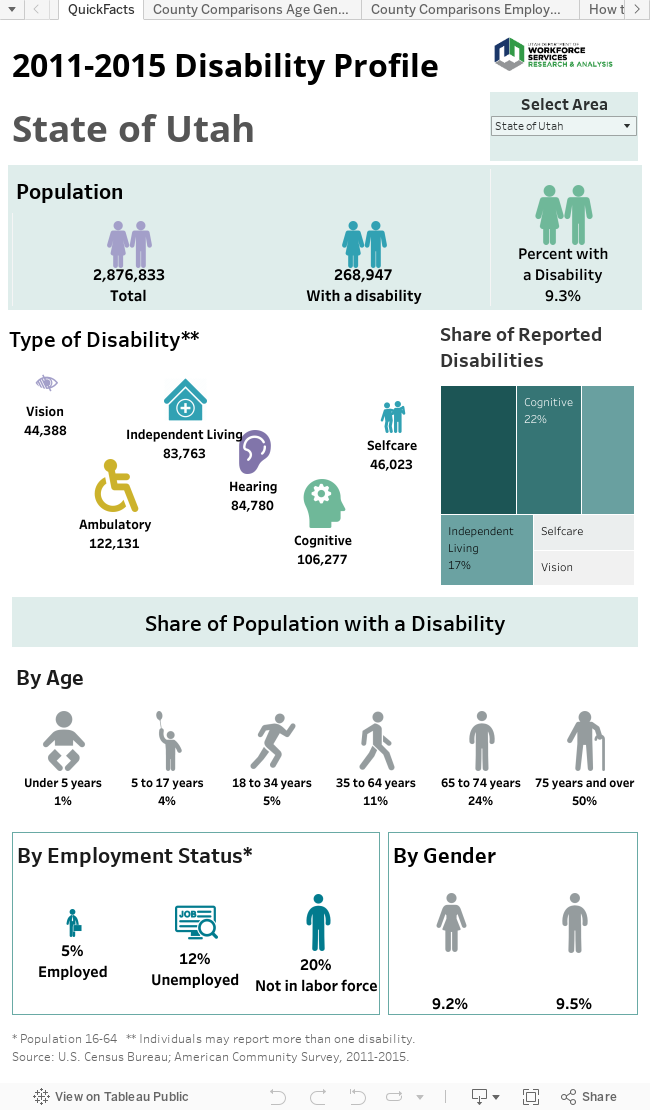
Profiling Utahns with Disabilities


For complete post and narrative, click here.

Tuesday, September 5, 2017

Brian Head fire rehabilitation treatments underway

A $3 million emergency rehabilitation treatment is currently being implemented in the aftermath of the Brian Head fire. About 119,000 pounds of new seeds have already been dispersed by helicopter onto the 5,000 acres on the most severely burned soil. The seeds were specifically engineered for quick germination and resilience. Crews are now working to top the new seeds with a layer of straw mulch to help foster the new growth. The mulch will also alleviate some of the water runoff.

The Utah Division of Wildlife Resources will plant seeds on up to 20,000 acres in October or November. In total, approximately 25,000 acres could be treated with new seeds prior to the start of winter. The emergency treatment funding will also be used to repair roads and trails. Overall, the total rehabilitation costs are projected to exceed $80 million. The U.S. Forest Service and Bureau of Land Management will share the bill with the state since the fire ravaged local, state and federal lands. The Spectrum

Utah State University study says national monuments are neither economic ‘boon nor bane’

A recent study by Utah State University professors Paul Jakus and Sherzod Akhundjanov concludes that landscape-scale monuments are “neither a boon nor a bane.” The USU economists compared changes in per-capita income for Garfield and Kane with changes in Utah’s other counties and four bordering counties in Arizona. They found incomes rose in step with comparable counties, although they remain lower than the state as a whole. They applied their methodology to three other big Clinton-era monuments — Canyons of the Ancients, Carrizo Plain and Upper Missouri River Breaks — and came up with similar results.

The Grand Staircase designation precluded the development of promising coal leases on the Kaiparowits Plateau, but that lost opportunity was offset by the dozens of businesses established in the towns rimming the monument to serve visitors and migrants coming to enjoy the region’s beauty, said Jakus, who heads USU’s Center for Society, Economics and the Environment.

The USU study also concluded the Staircase designation had minimal impact on grazing, despite ranchers’ complaints that monument rules are putting them out of business. Declines in stocking levels, it found, were likely the result of the cyclical nature of the cattle industry, which happened to peak the year the monument was designated, and persistent drought, which has reduced available forage. Salt Lake Tribune

Monday, August 14, 2017

Construction at Bryce’s Sunset Point underway

Construction is underway to address aging asphalt, reclaim natural areas and improve accessibility in the park’s Sunset Point area. Access to Sunset Point and the Navajo Loop Trail will be maintained throughout the duration of the project, which is expected to wrap up next spring, according to park officials. Deseret News

High Economic Value of Quiet Recreation in Southern Utah

Non-motorized (quiet) recreation activities like camping, hiking, hunting, mountain biking and wildlife viewing on public lands are a significant economic driver in local communities near where the recreation activities take place according to a new report by the independent firm ECONorthwest.

The report titled “Quiet Recreation on BLM-Managed Lands in Southwest Utah” shows that in 2015 the 364,000 quiet recreation visits to SW Utah BLM lands generated $17.4 million in direct spending within 50 miles of the recreation sites. The study shows 204 Utah jobs are supported locally as a result of quiet recreation visits to BLM Land.

The report comes as the Bureau of Land Management (BLM) is updating their resource management plan for the Cedar City Region. The BLM’s Cedar City Field Office in Southern Utah oversees 2.1 million acres of public land within Iron and Beaver counties. This report is the first ever to quantify both the amount of quiet recreation and the spending associated with quiet recreation specifically on BLM lands in this region of Southern Utah. Utah Business Magazine

Wednesday, July 26, 2017

“New and Improved?” A look at the Retail Trade Industry in Southwest Utah

By Mark Knold, Supervising Economist and Lecia Parks Langston, Senior Economist

“Almost no one wants to admit the genius of Jeff Bezos and Amazon. Apparently, many have failed to see that Amazon has become the world's biggest retail company.” Hubert Burda

Consumer spending makes up around 68 percent of the nation’s gross domestic product. Consumer spending is individuals and families purchasing groceries, clothing, recreation, stocks, insurance, education and much more. The transactions cover a broad swath of economic activity.

Much of the nation’s consumer spending is captured via retail trade. A useful retail trade definition is “the re-sale (sale without transformation) of new and used goods to the general public, for personal or household consumption or utilization.” Not all consumer spending is captured through retail trade transactions, but a large share is.

Broad-category examples of retail trade sectors are motor vehicle sales, furniture stores, electronic stores, building material stores, grocery stores, pharmacies, gas stations, clothing stores and department stores, among others.

Then there is the relatively new and emerging part of the retail trade sphere — non-store retailers. These are establishments that sell products on the internet. Examples include Amazon, Zappos, Overstock.com, or eBay. These types of retailers have grown rapidly in the past 15 years and their presence is reshaping the retail trade landscape.

Whereas in the past nearly all retail transactions were done through traditional brick-and-mortar stores, now a significant and growing segment is diverted to internet sales. The consumer shops online and goods are delivered to the customer’s doorstep. One can see that the number of brick-and-mortar stores and the level of local sales across the country are being endangered by this economic evolution.

The brick-and-mortar reduction is beginning to show its economic presence in the United States employment numbers. While the U.S. economy is finally expanding at a healthy pace this side of the Great Recession, one of the few industries not rising with this tide is retail trade. While overall retail sales are increasing, employment is not.

Traditionally, as a population increases, retail trade employment grows simultaneously, since population growth and consumer spending volume is an integrated dynamic. If studied deeply, a certain ratio of retail trade employment growth spawned from population growth would emerge. Before the internet, the vast majority of all consumer sales occurred in the immediate community or region. But now, the internet is diverting these sales away from the local community — and with internet sales growing, its market share will increase.

We do not yet know how much brick-and-mortar erosion will eventually occur. And will such a phenomenon hit some areas more than others (e.g., urban vs. rural, or local vs. tourist spending)? These are touch points that economist will be watching as this Internet sales phenomenon continues to grow within the national and Utah economies.

In light of this change, in this quarter’s Local Insights we are profiling retail trade employment throughout Utah’s local regions. This can offer a profile of where retail trade is now in a local economy, and possibly how much of the sector could become vulnerable to the internet-sales phenomenon.

All regions can be viewed through the Local Insights web portal. The following is a retail trade profile for the Southwest region:

Trending Upward


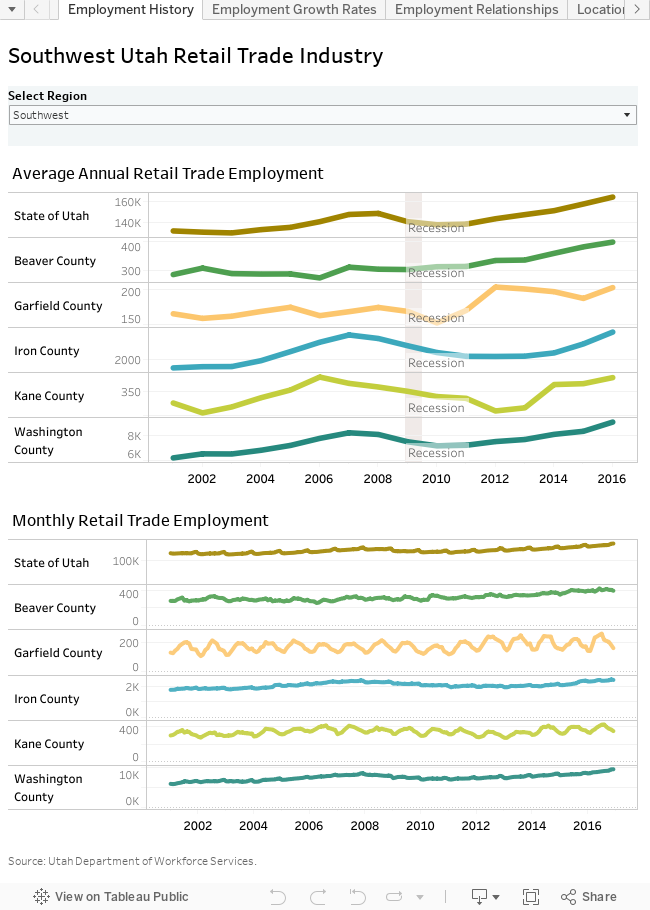
Just how important is retail trade employment in the southwest corner of Utah? In 2016, roughly 12,400 Southwest Utah workers were employed in retail trade representing 14 percent of total nonfarm employment in the region. That’s slightly higher than the statewide retail average of 12 percent. The current employment level represents a regional high point. Moreover, despite the revolution in online buying, employment in retail trade has trended upward in Southwest Utah — although it has ebbed and flowed during boom, recession and recovery. Of course, the region’s population growth provides a major factor in retail trade employment expansion in Southwest Utah.

In most Southwest Utah counties, growth rates swelled in the mid-2000s, toppled during the recession and surged back as the recovery took hold. Yes, retail trade is certainly susceptible to the business cycle. During the recovery, Garfield County led the pack with early retail trade gains only to experience job losses when other counties picked up speed. In contrast, both Kane and Iron counties were slow to add retail jobs in the recovery period. Retail trade employment in both counties just barely returned to the pre-recession peak levels.

Tis the Season


Retail trade employment can be very seasonal in nature. In both the Garfield and Kane economies, a strong tourism and recreation component produces a significant seasonal pattern with employment peaking in the summer months and bottoming out in January or February. In Garfield County, retail trade jobs can double between trough and peak. While tourism isn’t as profound in Beaver County, retail employment also peaks in summer as the industry services travelers along the I-15 corridor. Washington and Iron counties experience less seasonality, but also see their lowest retail employment levels as the year begins. However, in these two counties, holiday shopping creates a slight seasonal peak in December. This pattern follows the statewide lead.

Dependency


Some counties in Southwest Utah are more dependent on retail trade employment than others. Statewide, retail trade employment accounts for about 12 percent of total nonfarm jobs. Beaver (17 percent), Washington (15 percent) and Iron (14 percent) counties all show higher percentages of retail trade employment than the state. Iron and Washington are self-contained, regional shopping centers which probably accounts for their higher-than-average retail shares.

Despite their tourism-dependent economies, Kane and Garfield counties show smaller percentages of retail trade employment overall. This is partially due to the high levels of leisure/hospitality employment in these counties. In addition, tourism’s contribution to retail trade employment typically lasts only half the year.

Location quotients (LQ) provide a different way of looking at the importance of an industry. These ratios compare an area’s industry employment share to that of the nation. A retail trade LQ of 1 indicates the area’s industry employment makes up the same share of employment as that industry does nationwide. A location quotient greater than 1 means the area’s industry has a greater employment share than the United States. Utah’s retail trade location quotient measures just higher than 1. However, Beaver, Iron and Washington counties all have retail trade location quotients of 1.3 or higher, attesting to the magnitude of retail employment in these areas. On the other hand, Kane’s LQ is exactly 1 while Garfield County shows an LQ of 0.78. In other words, retail employment is far less important in Garfield County than in other Southwest Utah counties, the state and the nation.

Over time, the share of retail trade employment has remained fairly steady in the most populated Southwest counties. On the other hand, in Beaver and Garfield counties, retail trade has taken on a more important employment role in the post-recession years.

Relationships


Population per retail worker also provides insights into the retail trade industry’s local importance. Statewide there are roughly 16 residents per retail trade job. Despite being the most tourism-dependent county in Utah, Garfield County shows 24 residents per retail trade worker, the highest in the region. On the other hand, Washington County’s population per retail trade job measures less than 15, which seems to reflect its importance as a regional shopping destination. In general, the ratio of population to retail trade employment has trended downward, which seems to reflect the incursion of online shopping.

Down to Subsectors


In Southwest Utah, general merchandise stores (e.g., Wal-Mart, Target, Dillards, JC Penny) account for the largest subsector share of retail trade workers — 20 percent. Food and beverage stores ran neck-and-neck with these stores with just less than 19 percent of total employment. Motor vehicle/parts dealers (13 percent), building materials/garden stores (12 percent) and gasoline stations (10 percent) are also major employment players in retail trade.

The job shares of retail trade subsectors vary between Southwest Utah and the state overall. Southwest Utah shows higher employment shares in building material and garden stores, food and beverage stores and gasoline stations than Utah. In contrast, the region shows smaller employment percentages in clothing stores, electronics stores and especially non-store retailers. In other words, Southwest Utah employment does not appear to be benefitting from online sales.

A Fair Share?

Since 2000, general merchandise stores have slowly eked out a higher share of retail trade employment. In 2000, roughly 16 percent of Southwest Utah retail employment was at general merchandise stores. Since that time, general merchandise stores have increased their share by 3 percentage points. Building material and garden stores have also seen employment shares increase as several big box retailers entered the area.

On the other hand, food and beverage stores’ share of retail trade employment has decreased slightly. The inclusion of groceries at some big-box stores has probably tapped into some of the food and beverage store employment. On the other hand, many traditional grocery stores now also carry non-grocery items.

Wages


Retail trade is not known for its excessive wages. In 2016, only private education services, and leisure/hospitality services showed lower average monthly wages in Southwest Utah. Not only are retail trade hourly wages lower than average — many jobs are part-time, which contributes to its lower-than-average standing.

Statewide, the average monthly wage for a retail trade worker measures less than $2,600. Not surprisingly, the average retail trade wage measured even lower in all Southwest Utah counties. Nevertheless, a wide disparity in wages exists even within the region. In Washington County, the 2016 average monthly retail trade wage registered at about $2,200, while in Garfield County, the average was a mere $1,400. Iron County’s wage ($2,100) measured slightly below the Washington figure. Beaver ($1,600) and Kane ($1,600) landed closer to the Garfield County wage.

Interestingly, during the pre-recession years when Washington County experienced rapid employment growth and short-term labor shortages, its average monthly retail wage actually surpassed the statewide figure. (It was that whole supply and demand thing at work.) Of course, once recession hit, wages returned to a more historical relationship.

The Same, but Different


Retail trade wages also show a notable variety in relationship to the average county wage. Statewide the retail trade industry wage measures 70 percent of average. In both Iron (84 percent) and Washington (80 percent) counties, retail trade wages compare more favorably to the overall county average. In Beaver and Garfield counties the retail wage measures about 56 percent of average; Kane County’s figure is slightly higher at about 65 percent.

Between 2001 and 2016, the gap between the retail trade industry wage and the average wage widened in all counties — and the state. This suggests that wages in other industries have increased faster than those in retail trade.

Within the retail trade industry in Southwest Utah, jobs at motor vehicle/parts dealers show the highest average wage followed by building materials and garden stores. On the low end of the scale, clothing stores paid the lowest wages.

Thursday, June 1, 2017

Is Your Town Growing?

U.S. Census Bureau releases 2016 City Population Estimates


By Lecia Parks Langston, Senior Economist

“A city is more than a place in space, it is a drama in time” –Patrick Geddes

Most of Utah’s cities and towns grew in 2017, according to population estimates recently released by the U.S. Census Bureau. Lehi even ranked 11th among the nation’s fastest-growing large cities. However, not all Utah’s cities and towns experienced growth.

Use the visualization and bullet points below to explore population trends for individual townships.


• The old Geneva Steel Mill site continues to be fertile ground for population expansion. Vineyard was once again the fastest growing city in Utah. However its rate of growth has slowed dramatically since 2015. In addition, Vineyard remains relatively small in size.

• Herriman added the highest number of new residents of any city in Utah (4,550) followed by Orem, Lehi and South Jordan. All showed higher population gains than Salt Lake City — Utah’s most populous city. Herriman also showed the second-fastest rate of expansion in 2016.

• St. George was the only city outside the Wasatch Front to increase its population by more than 2,000 residents.

• The top four population-gaining cities in Utah are all located in southern Salt Lake County or northern Utah County, as the metropolitan population continued to spread outward from the large city centers. Fastest-growing larger communities also tended to be located near the Salt Lake County/Utah County border.

• Due to the nature of percent-change mathematics, several small towns (such as Monticello, Mantua, Francis, Interlaken and Hideout) showed high growth rates although their new-resident counts measured relatively low.

• The Census Bureau estimates that most of the cities and towns showing population declines were located in the Uintah Basin, Carbon County and Emery County. Declines in resource-based employment have spearheaded these population declines.

• In addition, Millard, Piute, Garfield and Wayne counties displayed a significant number of contracting townships.

• Salt Lake County remains home to five of the 10 largest cities in the state. Utah County accounts for another two in the top 10. St. George is the only city in the top-10 ranking located outside the Wasatch Front.

Friday, May 12, 2017

Zion, Bryce combined to bring $445 million to southwest Utah

Tourism to southwest Utah’s national parks and monuments brought more than $1 billion to the local economy in 2016, according to report issued by the National Parks Service. A combined 7.6 million visitors spent an estimated $506 million while visiting Zion National Park, Bryce Canyon National Park, Cedar Breaks National Monument and Pipe Springs National Monument, supporting nearly 7,300 jobs across southwestern Utah, according to the annual peer-reviewed economic analysis. The Spectrum

Thursday, April 27, 2017

Census Bureau Tool Provides Labor-Force Insight for Utah

By Mark Knold and Lecia Langston

Across the United States, jobs are quantified through each state’s unemployment insurance program. Those programs provide the potential for laid-off workers to receive unemployment benefits — the goal being to bridge the gap between workers’ lost jobs and their next jobs. An eligible recipient’s weekly benefit amount is based upon their earnings from recent work. This begs the question, how does Utah’s unemployment insurance program know how much an individual recently earned while working?

That answer is supplied by all businesses that hire workers, as they must report their employees and pay as mandated by the unemployment insurance laws. Companies identify their individual workers and those workers’ monetary earnings for a calendar quarter. As businesses are identified by their industrial activity and geographic location, it is through the unemployment insurance program that aggregate employment counts by industry and location are calculated.

Yet each state’s profiling of individuals is quite minimal in the unemployment insurance program. The U.S. Census Bureau can bring more light to the overall labor force by supplementing said information with gender, age, race/ethnicity and educational attainment (imputed from American Community Survey responses) for Utah’s labor force.

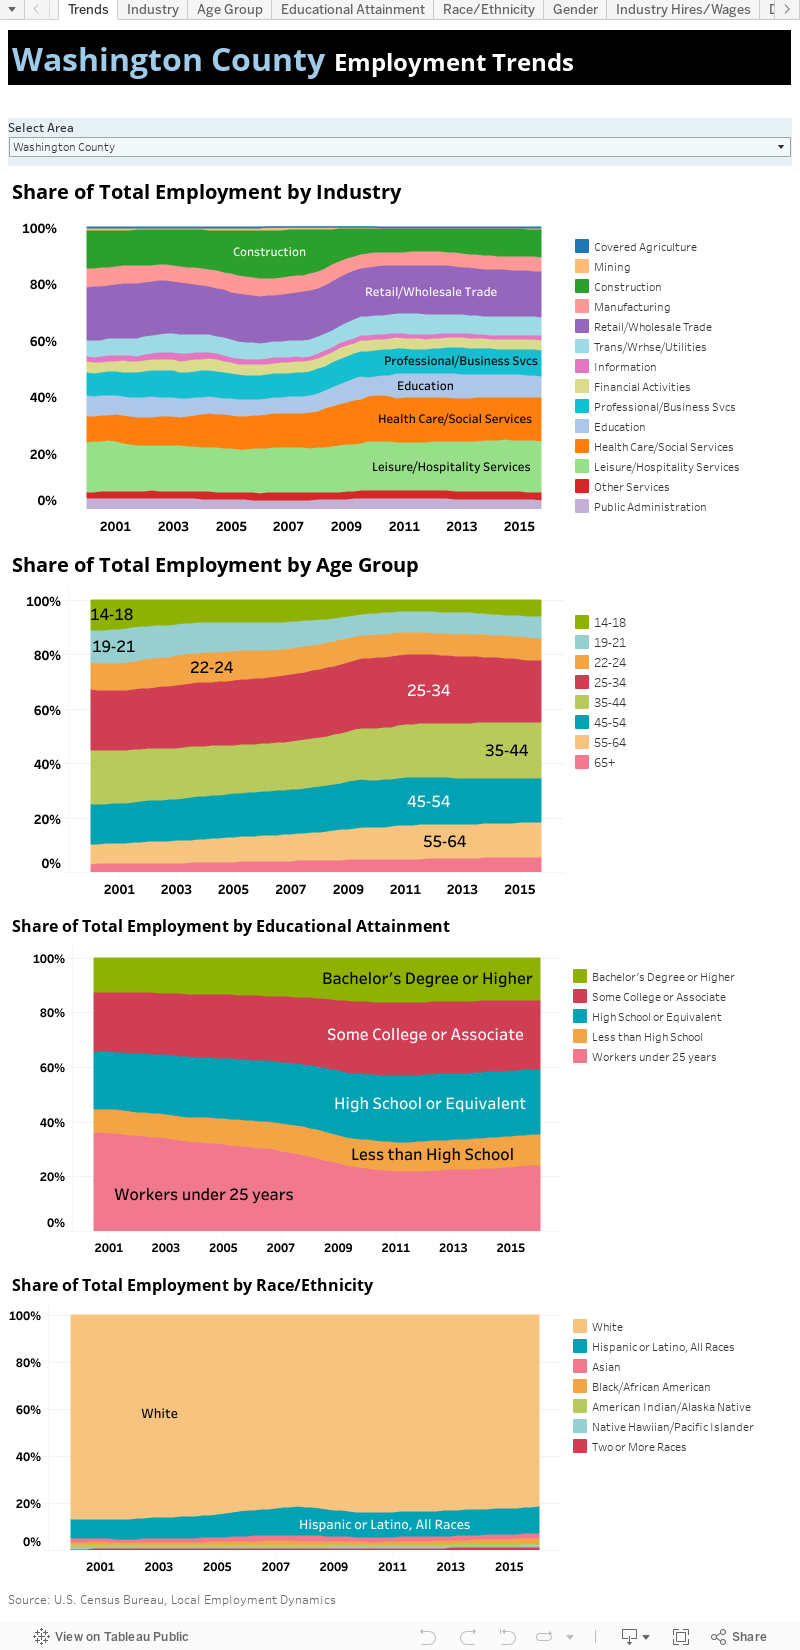
The Census Bureau packages this information through their Local Employment Dynamics program and makes available said data on its website. Here at the Department of Workforce Services, we recently downloaded and packaged Utah-specific data from said website and summarized it in the attached visualization.

Various data “tabs” are available, presenting Utah’s economy from different angles, ranging from industry shares within the economy to the age-group distributions of the labor force, to gender and race distributions. These labor variables can be viewed for the state as a whole, or by each individual county.


Health Insurance: Who’s covered in Utah?

Census Bureau Estimates Provide Answers about Utah Health Insurance Coverage


By Lecia Parks Langston, Senior Economist

“Most Americans want health insurance.” Jacob Lew

The U.S. Census Bureau just published its Small Area Health Insurance Estimates (SAHIE) for counties and states while the national discussion on health care laws receives renewed attention. Is this a coincidence? Yes, but a timely one. This post examines how health insurance coverage for Utahns has changed and also the demographics of who has coverage and who does not.

Tracking Utahns Under 65 Years of Age

Small Area Health Insurance Estimates cover the population under 65 years of age. Of course, virtually all residents 65 and older are covered by government-provided Medicare. Because the estimates date back to 2008, two years before the signing of the Affordable Care Act (ACA), the available figures provide an indication of the effect of the ACA on health insurance coverage in Utah and its counties.
More Utahns have Health Insurance

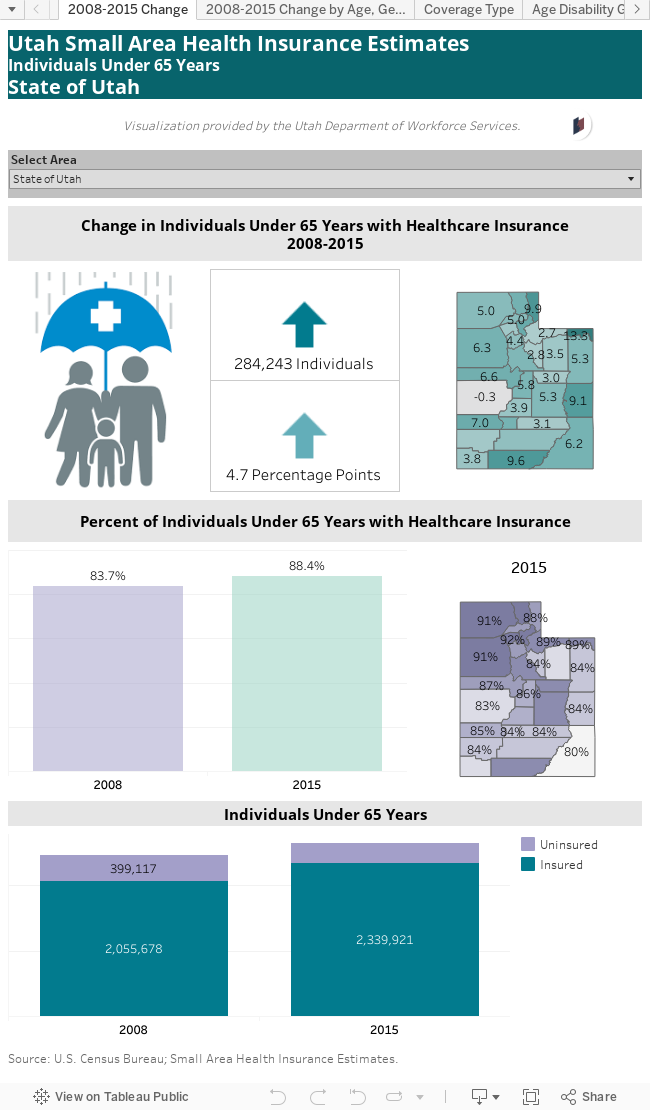
Between 2008 and 2015, the number of Utahns under 65 years old covered by health insurance increased by 284,000. Not only did the actual covered increase, but the share of non-senior population with health insurance also gained ground expanding from less than 84 percent to more than 88 percent — an increase of 4.7 percentage points.

Only Millard County experienced a very slight 0.3 percentage point decline in health insurance coverage although the actual number of persons covered increased by 113. Daggett, Rich, Kane and Grand counties showed the highest growth in under-65 coverage; each showed increases of at least 9 percentage points.

In 2015, counties in northern Utah generally showed the highest level of non-senior health insurance coverage. In Morgan, Davis, Box Elder, Tooele and Cache counties, health insurance rates top 90 percent. On the other end of the scale, rural counties in central and southern Utah display the lowest coverage. In San Juan, Millard, Duchesne and Wayne counties, health insurance rates for those under 65 measured 83 percent or less.

Those under 19 saw the greatest gains. Coverage rates for these young people increased from 87 percent in 2008 to 93 percent in 2015. Utah males experienced a larger gain in coverage between 2008 and 2015 (5 percentage points) than did females (4 percentage points), although females were more likely than men to carry health insurance in both years. Health insurance rates for those with the lowest incomes showed the most improvement (10.4 percentage points). However, their coverage shares remain roughly 10 points below average.

Wait, There’s More…

Tuesday, April 4, 2017

Utah national parks see major leap in visitation in 2016

National parks across the country saw record-breaking attendance in 2016, and Utah's parks were no exception. A new government report indicates there were 330.97 million total recreation visits to national parks, a 7.72 percent increase over 2015. In Utah, Zion National Park saw a 17 percent jump in visitation in 2016. Bryce Canyon National Park saw a 26 percent jump and there were similar increases at Arches, Canyonlands and Capitol Reef. In all, Zion National Park ranked fifth for the most-visited national parks in the country.

Officials attribute the boost in visitation to a strong economy, good weather, low gas prices and the National Park Service's Find Your Park marketing campaign, which aimed to draw more visitors to celebrate the 100th anniversary of its creation. Deseret News