Showing posts with label Economist--Lecia Langston. Show all posts

Thursday, May 28, 2020

Unemployment Insurance Claims Data Shed Light on the Local Economic Impacts of the COVID-19 Pandemic in Southwest Utah


By Lecia Parks Langston, Senior Economist


“You have power over your mind — not outside events. Realize this, and you will find strength.” Marcus Aurelius

In the wake of the COVID-19 pandemic, businesses lost revenues and workers lost jobs. But because of the time it takes to collect and collate data, economists have been left without much information to quantify the economic impacts at the local level.

But there is one ray of data illumination. Claims for unemployment benefits are promptly available and provide information about a large cross section of the economy. This post will outline what light unemployment claims data sheds on the state of southwest Utah’s economy.

While not all workers are protected by unemployment insurance laws, roughly 95% of jobs are covered. This makes claims data an exceptional source of information about the economy. Not included under unemployment insurance laws are most self-employed workers, about half of agricultural employment, unpaid family workers, railroad personnel (covered separately) and many nonprofit organizations (such as churches). Also, some out-of-work employees may not have worked a sufficient work history to qualify for unemployment insurance benefits, but may file anyway. Fortunately, in this time of economic distress, the social safety nets of the unemployment insurance program, special national COVID-19 funding and social programs are working together to keep workers’ income and well-being stable.

Unemployment claimants and the unemployed; they aren’t the same


Also, keep in mind that, in addition to individuals drawing unemployment benefits, the unemployment rate includes those entering and re-entering the workforce and noncovered groups without current employment. This means the number of “unemployed” will be greater than the number of claimants. In “normal” times, only about 40% of the “unemployed” are claiming benefits. The generally reported unemployment rate also has a work-search requirement. If you haven’t made any minimal attempts to find work, you aren’t counted as “unemployed.”

Watch this Space


While this analysis won’t be updated regularly, new data will be added to the data visualization on a weekly basis allowing readers to check back for the latest information.


An Unprecedented Event


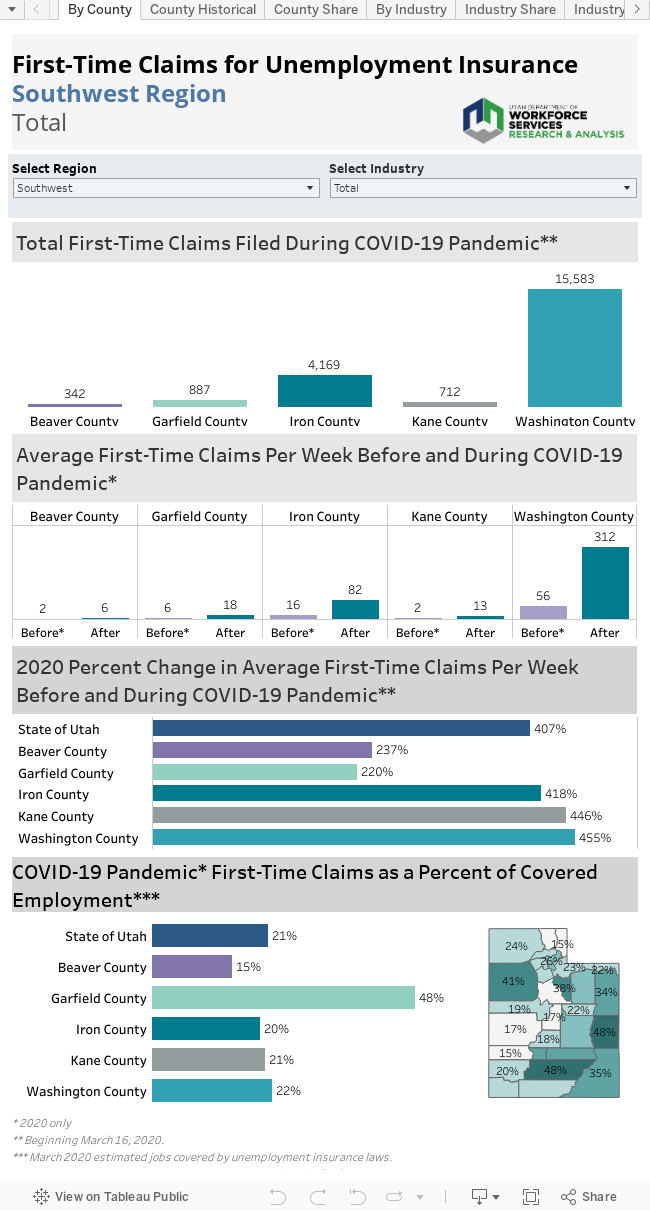
Not surprisingly, first-time claims for unemployment benefits soared in Utah and across the nation as the pandemic swept across the country. This increase is unprecedented since the creation of unemployment insurance coverage during the Great Depression. Week 12 (beginning March 16) marks the start of this unparalleled surge in claims. On a positive note, while new claims for unemployment benefits have skyrocketed in Utah, the state currently shows one of the lowest claims rates in the nation.

For most southwest Utah counties, initial claims peaked during week 13 (starting March 23) and have since tapered downward. During the peak week 13, initial claims filed totaled 2,364 in southwest Utah. In all of 2019, only 3,803 claims were filed in the region. By week 19, claims measured considerably lower but continued to run substantially greater than in previous years — even during the Great Recession.

Here’s another example of the tremendous flood of new claims. Prior to the COVID-19 pandemic, counties in southwest Utah averaged a total of 82 first-time claims per week. This time period in early 2020 included seasonally high claims weeks in January. In the weeks after, an average of 1,343 claims were filed for an almost unbelievable increase of 1,538%.

Who took the hardest hit?


Counties with a high-dependence on tourism have felt the greatest economic and employment shocks. In Garfield County, with the highest share of tourism-related employment in the state, roughly 20% of individuals covered by unemployment insurance have filed a claim — twice the rate of the state (10%) Moreover, many seasonal Garfield County workers were already drawing unemployment before the pandemic hit. In contrast, in Beaver County, only 4% of covered workers filed a claim during the pandemic. Iron (9%), Kane (10%) and Washington (11%) also felt the repercussions of upswing in furloughs and job loss.

Tourism and COVID-19


Especially in the early stages of the pandemic, this is a story of tourism-dependent industries. Almost 23% of post-COVID-19 initial claims filed in southwest Utah represented workers previously employed in accommodations and food services. In addition, the true effect of the pandemic on this industry is masked by a large number of claims classified as industry “unknown” in the early days of the claims flood. Undoubtedly, many of these claims would rightfully be classified in accommodations/food services if the appropriate information were available.

Other high-claims industries included retail trade, healthcare/social assistance (reflecting the cessation of elective procedures and visits) and administrative support/waste management/remediation (the home to temporary employment agencies). Many of these high-claim industries reflect their high share of total employment in general. In addition, they often serve the public face to face or encountered damage due to the decline in demand for travel.

The Industry Flow


While most of the high-claim industries felt the pain of the pandemic early on, other industries surged in later weeks. As the economic effects of other closures worked their way through the economy both manufacturing and transportation/warehousing proved relative latecomers to the layoffs in southwest Utah.

The High and the Low


Although accommodations/food services has generated the largest number of southwest Utah initial claims in the COVID-19 pandemic time period, in percentage terms, other industries have actually suffered more. For example, in the extremely small management of companies industry, roughly 50% of workers have filed for claims. The administrative support/waste management/remediation industries, which includes temporary employment firms, shows a first-time claims rate of 27%.

Because of its job-to-job nature, the construction industry typically accounts for 15-20% of first-time claims. However, although construction’s new claims have also increased, they have increased at a much slower-than-average rate. After the COVID-19 pandemic hit, construction contributed only about 5% of first-time claims. Ease of social-distancing and good weather have helped construction maintain employment levels. New claims measured just 3% of covered construction employment.

Only a portion of agricultural employment is covered by unemployment insurance laws. However, as companies work to keep America fed, agribusiness has laid off few employees. In Iron and Beaver counties, covered agriculture plays a notable role in the economy. However, only 1% of southwest Utah’s covered agricultural workers have filed a claim during the COVID-19 pandemic.

Public administration, educational services (including public and higher education), finance/insurance and utilities have also managed to keep a higher percentage of their workforces employed.

County by County


Beaver County


  • Prior to the COVID-19 pandemic, Beaver County averaged 2 unemployment claims per week compared to 16 new claims afterward, an increase of 834%.
  • Because of its relatively small share of hard-hit tourism-dependent employment and higher-than-average share of lightly-hit covered agricultural employment, Beaver County has shown a smaller increase in claims due to the pandemic.
  • New claims as a percent of covered employment measured just 4% — one of the lowest rates in the state.
  • As in many other areas, accommodations/food services produced the highest number of new claims, with few claims in healthcare/social assistance.
  • Unusually, arts/entertainment/recreation also contributed a high number of new claims.
  • Beaver County accounted for 2% of the Southwest Region’s new claims prior to the pandemic, but only 1% of claims afterward.

Garfield County


  • Despite having the highest percentage of leisure/hospitality employment in the state, Garfield County ranked third for the percentage of initial claims filed as a share of covered employment (20%) after the COVID-19 pandemic hit. This is likely because many seasonal workers were already drawing unemployment insurance payments when the pandemic began.
  • Prior to the COVID-19 pandemic, Garfield County averaged six first-time claims per week, compared to an average of 53 claims per week afterwards. This change represents an increase of 856%.
  • Nearly 70% of claims were filed from workers furloughed from the accommodations/food service industry. A large share of claims from the “unknown” industry category most likely originated from this industry as well.
  • Apart from retail trade, other industries contributed few new claims.
  • Seasonal claims from the colder months meant Garfield County’s initial claims actually accounted for a larger share (6%) of the Southwest Region’s figure before the pandemic than after (4%).

Iron County


  • In the weeks before the COVID-19 pandemic, Iron County averaged 16 initial claims per week. After the pandemic hit, an average of 236 claims were filed per week, marking an increase of 1,390%.
  • In Iron County, first-time claims during the pandemic measured 9% of covered employment. That places Iron County in the bottom half of a county-by-county ranking.
  • As in many counties, Iron County’s accommodations/food service industry accounted for the highest number of new claims during the COVID-19 slowdown.
  • Healthcare/social assistance and retail trade ranked second and third respectively for new claims.
  • First-time claims from the manufacturing spiked in late April.

Kane County


  • Despite having a high percentage of tourism-related employment, the county showed a middle-of-the-pack ranking for new claims as a share of covered employment (10%). As in Garfield County, many seasonal employees were already drawing unemployment benefits prior to the pandemic.
  • Prior to the COVID-19 pandemic, Kane County averaged a nominal two first-time claims per week compared with 44 claims after the pandemic struck. This increase of 1,708% ranked as the largest in the region.
  • Accommodations/food services, retail trade and arts/entertainment/recreation generated the highest number of initial claims during the pandemic.
  • Roughly 44% of Kane County’s post-directive initial claims originated in the accommodations/food services industry.
  • Kane County’s regional share of new claims held steady before and during the COVID-19 pandemic.

Washington County


  • Not surprisingly, the county with the largest employment in southwest Utah also generated the largest number of COVID-19-related first-time claims. However, its share of claims increased from 69% prior to the pandemic to 74% during.
  • Before the COVID-19 pandemic, an average of 56 initial claims were being filed in Washington County compared to an average of 994 claims in the following weeks. The pre-to-post-pandemic increase registered 1,668%
  • Initial claims for unemployment benefits filed during the pandemic as a percent of covered employment measured 11%, near the middle of a ranking of all Utah counties.
  • Although it has a higher-than-average share of employment in accommodations/food services industry, Washington County’s economy is more diverse than many less-populated counties in the state. This industry’s share of claims in Washington County measured only 19% compared to 69% in Garfield County and 44% in Kane County.
  • Here too, accommodations/food services was the source of the largest number of new claims followed by retail trade, administration support/waste management/remediation (which includes temporary employment agencies) and healthcare/social assistance.
  • Claims originating from both manufacturing and transportation surged towards the end of the pandemic time period.

Monday, April 20, 2020

Health Insurance In the Time of COVID-19

U.S. Census Bureau releases new 2018 Small Area Health Insurance Estimates

By Lecia Parks Langston, Senior Economist
 
“Americans want jobs. They want affordable health insurance. They want an education.” John McCain
 
 
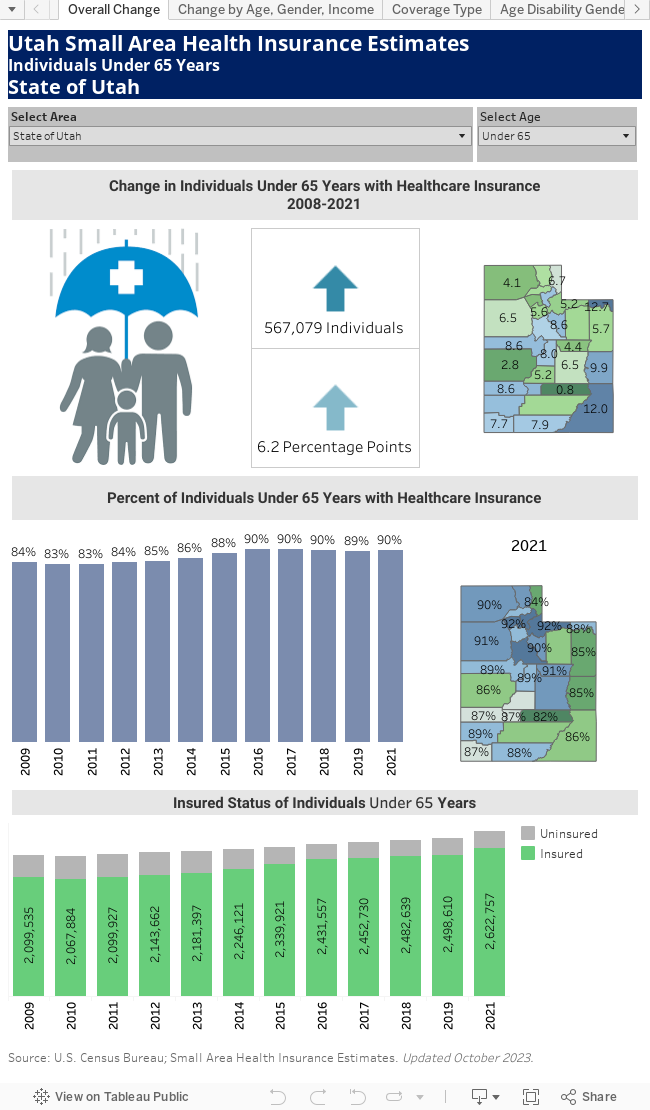
As the world hunkers down under the effects of a pandemic, the need for health insurance coverage becomes even more apparent than usual. Just how many Utahns are covered by health insurance? Who are the uninsured? Data just released by the U.S. Census Bureau (2018 Small Area Health Insurance Estimates (SAHIE)) provides enlightenment on healthcare coverage in the under-65-year-old population. Additional demographic information is available from the American Community Survey, rounding out our understanding of the insured and uninsured in Utah.
 

Small Area Estimates

The SAHIE estimates cover the population under 65 years of age. Of course, virtually all citizens 65 and older are covered by government-provided Medicare benefits. Because these estimates date back to 2008, two years before the signing of the Affordable Care Act (ACA), they suggest the how the ACA has changed the health-insurance landscape in Utah.
 
 
Compared to other counties across the United States, Utah’s counties, for the most part, had mid-level to high levels of insured individuals in 2018 (the most recent data available). National regions of high coverage include northern eastern states and the west coast. Texas seems to have the highest uninsured levels with a vast number of counties experiencing uninsured rates of greater than 20%. Most Utah counties have uninsured shares below 15%.
 
In 2018, Morgan, Davis, Daggett and Emery counties showed the highest insured rates in Utah. In contrast, San Juan, Duchesne, Uintah, Piute and Garfield experienced the lowest rates of health insurance coverage.


That was then, this is now

The number and share of Utahns covered by health insurance have certainly improved in the past 10 years. In 2008, roughly 83.7% of the under-65 population was insured compared to about 89.6% in 2018, an increase of nearly 6 percentage points. In terms of individuals, that increase represents a gain of 427,000 insured Utahns.
 
However, coverage appears to have peaked in 2016 at 90.3% and has since retrenched. The repeal of ACA’s individual mandate and price increases, due to the elimination of cost-sharing reductions to payers selling individual plans, likely contributed to the recent slight decline in Utah coverage. However, the state’s Medicaid expansion, effective in 2020, should help bump up insured rates.

Less-populated counties, with initial low insured rates, experienced the strongest gains in insured shares. Daggett, Rich, Grand, Kane and San Juan counties displayed gains of roughly 10-points or higher. While all counties showed an improvement in the insured share of the under-65-year population, Salt Lake, Carbon, Summit and Millard counties experienced the smallest gains.
 

Highlights from the American Community Survey (2014-2018)

  • Roughly 58% of Utahns (of all ages) are insured in full or in part by employer-provided plans. Only 9% directly purchase their entire insurance coverage from a private provider. In total, nearly 70% of the state’s citizens have private coverage.
  • In total, public plans (Medicare and Medicaid) cover roughly 12% of Utah’s population. About 7% of the population is covered by Medicaid with another 3% covered by just Medicare. Roughly 1% of Utahns have coverage under both Medicare and Medicaid.
  • Those with a combination of public and private coverage account for another 9% of Utah’s population. That group includes 4% of Utahns who carry Medicare plus a supplemental source of private insurance. On the other hand, 10% have no healthcare insurance at all.
  • The very young and the very old are most likely to carry health insurance. Thanks to Medicare, individuals 65 years and older are the most likely to be covered (99%). On the other end of the spectrum, children under 6 years old displayed a coverage rate of 94%, with 6-18 year olds not far behind (92%).
  • Individuals between the ages of 26 and 34 are the least likely to have health insurance. Only 84% are covered in Utah.
  • By gender, females (91%) are just slightly more likely than males (89%) to maintain health insurance. This may be partially due to the dominance of women in the highly-covered 65-years-and-older group.
  • Education shows a high correlation with health insurance coverage. Persons with a bachelor’s degree or higher show the highest coverage rate — 96%. On the other end of the scale, individuals who did not graduate from high school maintained an insured rate of just 68%.
  • Not surprisingly, of all labor force statuses, the unemployed are least likely to have health insurance (65%). Interestingly, those not in the labor force (which would include the retired), display an insured rate just slightly lower than the employed. In addition, based on work experience, individuals working full-time, year-round are the most likely group be insured.
  • Household income is also a good predictor of health insurance coverage. Those with the highest incomes ($100,000 and over) have the highest coverage rates (95%). In contrast, those with the lowest incomes (under $25,000) have the lowest coverage rates (81%). a
  • Latino and Native Americans show the lowest rates of any major ethnic/racial groups. Rates for both sets measure just 73%. White, non-Latino Utahns maintain the highest health insurance coverage shares.
  • Only 56% of noncitizens have health insurance in Utah compared to 92 percent of Utahns born in the United States.

Tuesday, April 7, 2020

The U.S. Census Bureau Releases County Population Estimates for 2019

Next year, actual counts from the decennial census will be available

By Lecia Parks Langston, Senior Economist
“Any time you have population growth, there are business opportunities.” Roland Dorson
 
Hopefully, all Utahns are taking a break from COVID-19 concerns to respond (by phone, online or by mail) to their 2020 Census questionnaires (https://2020census.gov/). Since the Census results help determine how billions of dollars in federal funding are spent, accurate counts are important in order for Utah’s communities to get their “fair share.”
 
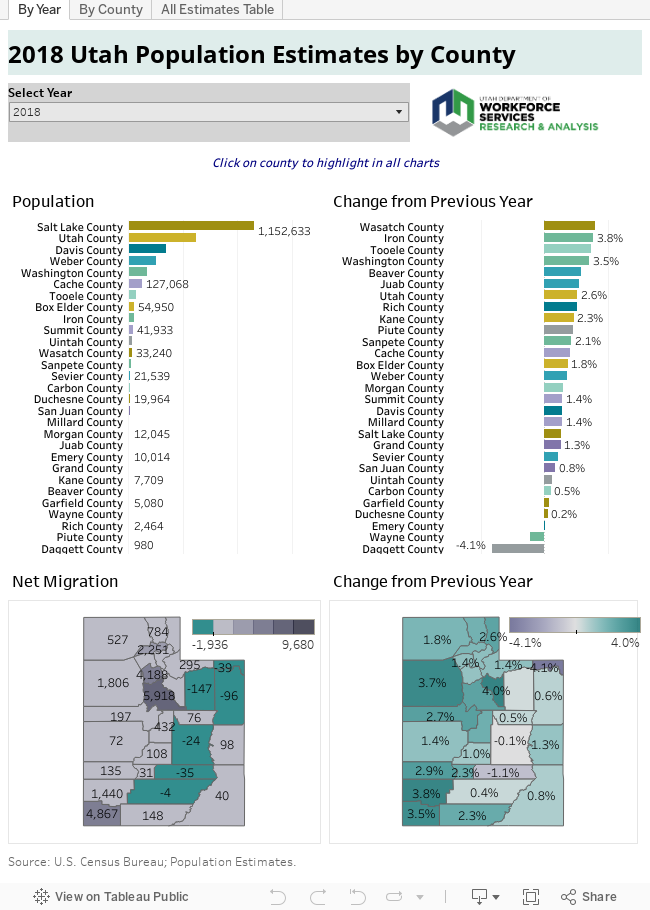
Because the actual counts are not yet available, the U.S. Census Bureau has just released the last set of population estimates for the decade. What do they show?


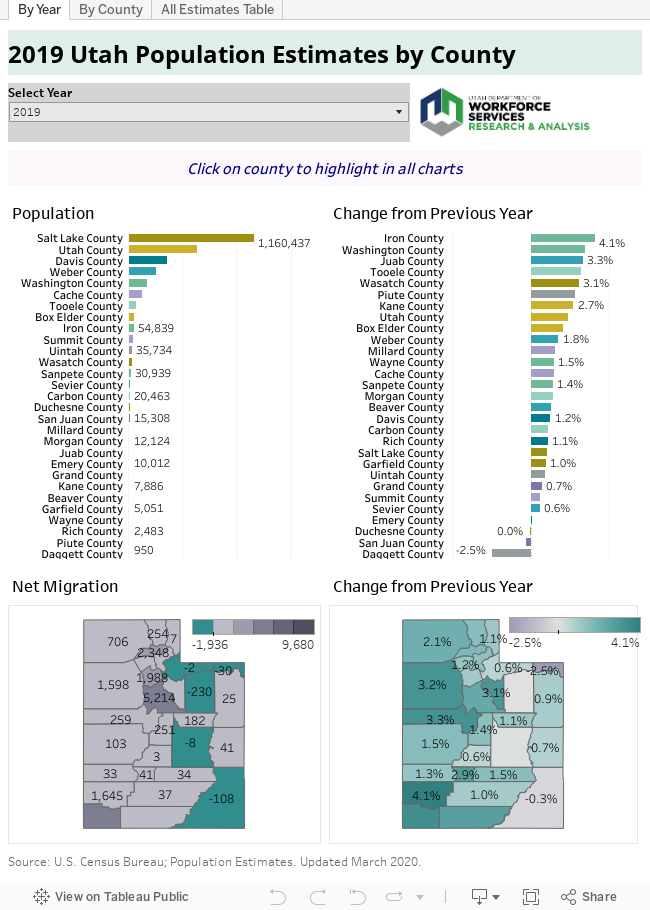
  • Iron County took the lead in population growth rates for 2019 — up by 4.1%. Following close behind was its neighbor, Washington County, with a growth rate of 3.5%.
  • Other fast-growing areas included counties at the edge of urban spread, such as Juab, Tooele and Wasatch.
  • Although Piute County saw an increase of only about 30 individuals, its small base population also resulted in a strong percentage increase (2.9%).
  • Utah County showed the highest percentage increase (2.4%) of the big-four Wasatch Front counties.
  • Estimates for both San Juan and Daggett counties suggested a decline in population, while Duchesne County’s population appeared to hold steady.
  • Utah County experienced the largest numeric gain in population — nearly 15,000 residents, followed by Salt Lake County (up about 12,000) and Washington County (up nearly 6,000).
  • Utah and Washington counties finished neck-and-neck in the race for net in-migration. Utah County’s net in-migration measured 5,200 compared to 5,100 for Washington County.
  • Several counties displayed net out-migration. Most notable on the list were Duchesne and San Juan counties. Daggett, Emery and Summit counties showed lesser out-migration estimates.
  • For its size, Utah County shows a relatively high number of births and a low number of deaths, placing its natural increase not far behind population-dense Salt Lake County.
  • Although Washington and Cache counties showed roughly equivalent numbers of births, deaths in Washington County measured much higher.
  • In 2019, Emery County experienced its first (albeit small) population growth in more than a decade.
  • Morgan County’s 2019 growth rate slipped below the state average for the first time this decade.
  • Wayne County saw its best population growth (1.5%) of the past 10 years in 2019.
  • Between 2010 and 2019, Wasatch County was the third fastest growing county in the nation. Washington County (St George, UT MSA) was the fifth fastest growing metropolitan area in the United States between 2010 and 2019. Its relatively small size contributes mathematically to a high growth rate. The Provo-Orem, UT MSA ranked ninth.
These aren’t the only estimates in town. The Kem C. Gardner Policy Institute at the University of Utah has assembled the Utah Population Committee (UPC) to reinstitute the population-estimates work previously conducted by the Utah Population Estimates Committee (UPEC). These estimates can be found here.
U.S. Census Bureau estimates use the same methodology in producing population figures for every county in the nation. Therefore, for nationwide comparisons, U.S. Census Bureau estimates may have the advantage. On the other hand, UPC population estimates have the benefit of local-analyst expertise and additional data sources.

Thursday, March 28, 2019

Where Have All the Young Workers Gone?

Young workers in Utah and the U.S. comprise a smaller share of the labor force


By Lecia Parks Langston, Senior Economist
 
"We should be trying to reach the young workers because that’s when you’re most idealistic and have least fear."  John Lennon

 
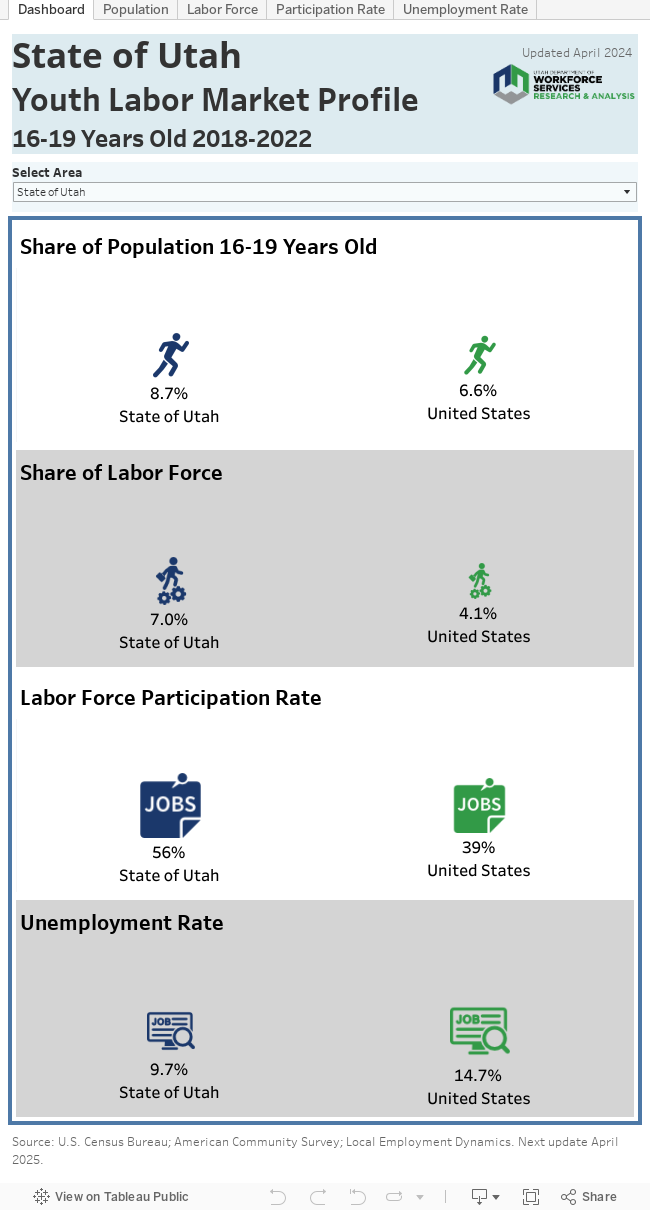
One of the most striking labor market changes of the last decade and a half is the declining participation of teenagers in the labor force. Nationally, teenage participation topped out at almost 59 percent in the late 1970s, and today stands at roughly 36 percent. While the trend isn’t as pronounced in Utah as it is nationwide; here, too, young people are less likely to be employed or looking for work than they were as the century began. The reasons for this phenomena are not clear. However, more after-school activities and increased borrowing to pay for post-secondary education (rather than earning while learning) may factor into this decline.
 
On the other hand, some characteristics of youth workers have changed little. Utah teens still show some of the highest labor force participation rates in the nation. Also, young people continue to show the highest unemployment rates, the lowest wages and the top turnover rates of any age group.
 

Monday, December 17, 2018

New GDP figures will add to the local economic-analysis tool box


New GDP figures will add to the local economic-analysis tool box

By Lecia Parks Langston, Senior Economist

“We will find neither national purpose nor personal satisfaction in a mere continuation of economic progress, in an endless amassing of worldly goods. We cannot measure national spirit by the Dow Jones Average, nor national achievement by the Gross National Product.”  Robert Kennedy
As a regional economist, I’m routinely asked for gross domestic product (GDP) figures for Utah’s counties. After all, nationally, GDP is routinely tracked as an economic indicator. “Sorry,” I say, “the Bureau of Economic Analysis (BEA) doesn’t produce GDP statistics for counties (unless they are a metropolitan statistical area). But data-lovers, “the times, they are a-changin’.”
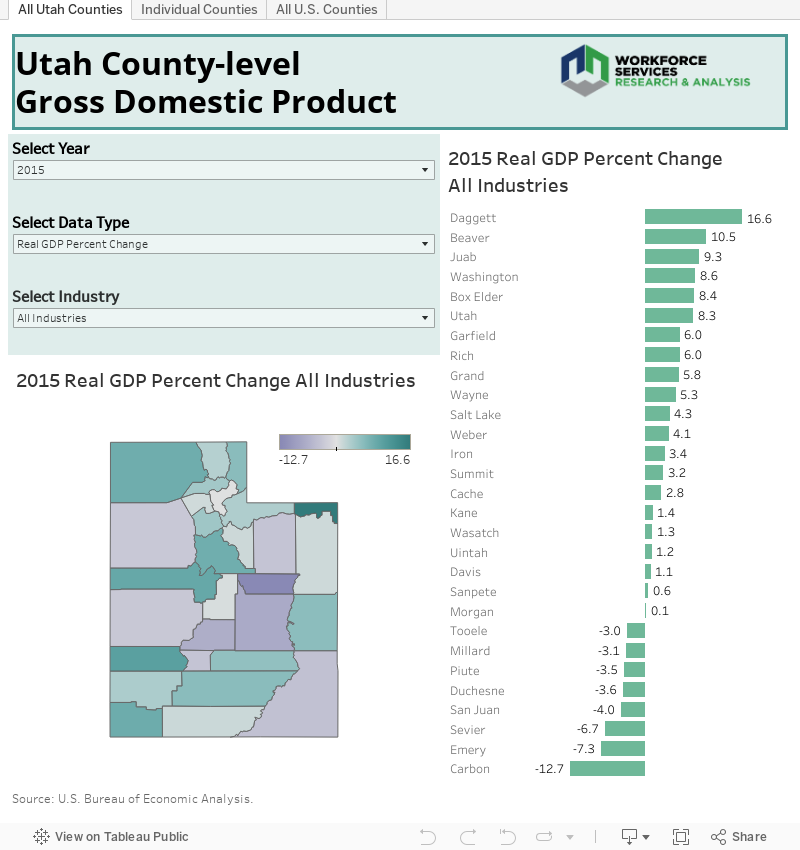
The U.S. Bureau of Economic Analysis has just released proto-type county GDP statistics for 2012 to 2015. You can explore the data in the visualization that follows.


Yes, the proto-type information is dated. However, data-users can take a first-look at the series and assist BEA by providing feedback and comments on the prototype data via e-mail at gdpbycounty@bea.gov. Official statistics are scheduled for release in December 2019.
When the official data is released, this new data will add to our ability to analyze Utah’s local economies.
What do the proto-type figures reveal? Here are a few highlights:
In 2015, eight Utah counties experienced a decline in GDP following a trend similar to 2013 and 2014.
  • Less-populated counties were most likely to experience a bout of declining GDP.
  • Daggett County, one of Utah’s smallest in both geographic size and population, showed the highest GDP growth rate in 2015 with Washington County showing the highest rate of expansion among more-populated counties.
  • It wasn’t uncommon for Utah counties to experience at least one year of GDP contraction between 2013 and 2015.
  • Not surprisingly, the vast majority of GDP is generated along the Wasatch Front.

Monday, March 5, 2018

Utah's Seasonally Adjusted Unemployment Rates

Seasonally adjusted unemployment rates for all Utah counties have been posted online here.

Each month, these rates are posted the Monday following the Unemployment Rate Update for Utah.

For more information about seasonally adjusted rates, read a DWS analysis here.

Next update scheduled for March 26th.

Monday, January 29, 2018

Ten Years Later. . .

The Recovery Following the Great Recession


By Mark Knold, Supervising Economist and Lecia Parks Langston, Senior Economist

“The term 'business cycle' is imprecise. Economic fluctuations affect everyone, not just businesses, and they are, unlike astral cycles, anything but regular.” Kevin Hassett

Overview


December 2017 marked 10 years since the Great Recession first cast its long shadow across the American economy. The recession officially lasted 18 months, but its consequences can still be seen across the country without having to look very hard. We have not had another recession since.

Utah was hit hard at the time, losing a larger share of jobs than the national average; but, we were fortunate to be one of the most resilient states in terms of economic rebound. There are plenty of states where the Great Recession continues to weigh upon them. Employment levels in 14 states are still not back to their pre-recession peak, and another 29 states have only grown 5.0 percent or less. As the working-age population has grown by more than 5.0 percent, the job gains nationally have not been enough to fully employ working-age labor.

Utah lost 7.0 percent employment during the recession. Since that low, employment has recovered by 18 percent. That is the second best rebound in the nation. From Utah’s pre-recession employment peak to now, Utah’s employment has increased by 9.5 percent, third best in the nation. Yet, Utah’s job growth has not been enough to absorb all of the labor force growth during that time. Utah’s unemployment rate is low, but the percent of the working-age population in the labor force is several percentage points below the pre-recession norm — telling us that potential labor is still not as fully engaged with the job market as before the recession.

As a whole, Utah has had a notable recession rebound, but those gains have not been shared equally across all regions. Just like the national profile, some areas have bounced back strong while others are still lagging behind. The state’s metropolitan areas have grown well, but many of Utah’s rural areas cannot say the same. Nine counties have employment levels below their pre-recession peaks.

In this issue of Local Insights, we profile Utah’s regional and county economies in light of the 10-year span since the Great Recession.

Southwest Utah and the Recovery


The five counties in Southwest Utah — Beaver, Garfield, Iron, Kane and Washington — each experienced the Great Recession and the ensuing recovery in their own way. Unfortunately, this corner of Utah generally took longer to pull out of the downturn than did Utah or the nation.


Washington County


Washington County was an uninhibited participant in the housing bubble that was the precursor to the Great Recession. Not surprisingly, its crash was longer and deeper than other less-involved counties. For almost three years prior to the economic collapse, Washington County showed 10-percent job growth as construction industry employment exploded. In this case, what went up definitely came down. The worst job-loss month in Utah registered a 6.2-percent decline (year-to-year), while the nation’s worst comparable loss measured 5.0 percent. Washington County’s loss imitated its prerecession gains at 9.7 percent. Moreover, Washington County just kept losing jobs at this rate while the state and the nation bounced back.

Monday, December 4, 2017

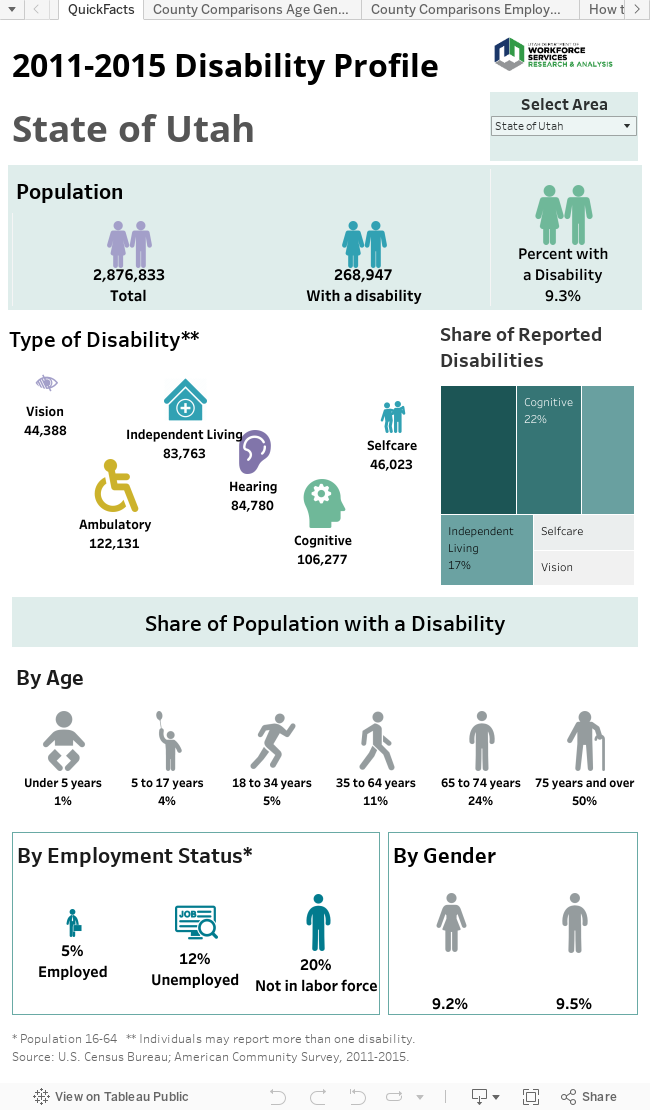
Profiling Utahns with Disabilities


For complete post and narrative, click here.

Wednesday, July 26, 2017

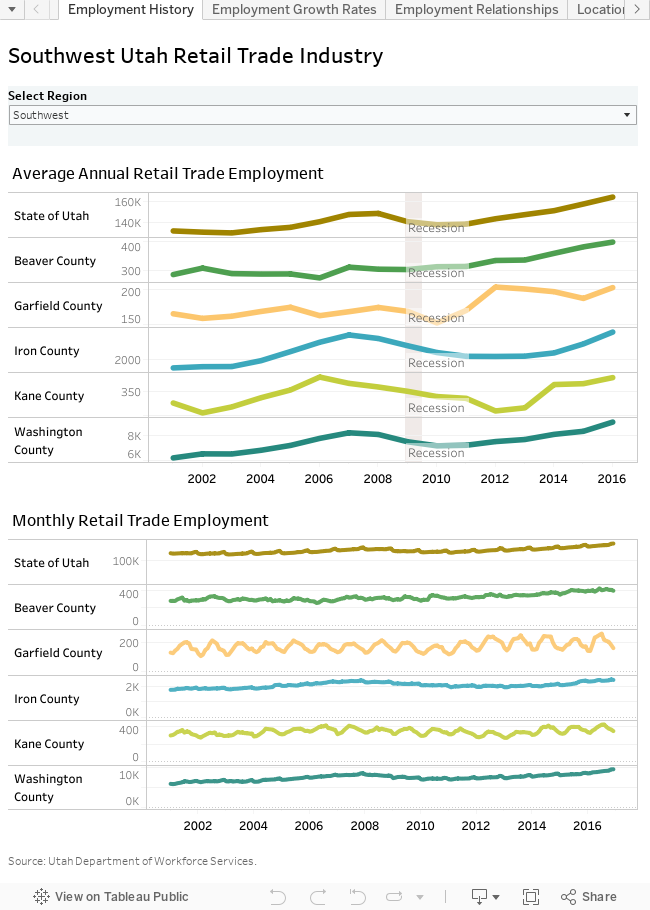
“New and Improved?” A look at the Retail Trade Industry in Southwest Utah

By Mark Knold, Supervising Economist and Lecia Parks Langston, Senior Economist

“Almost no one wants to admit the genius of Jeff Bezos and Amazon. Apparently, many have failed to see that Amazon has become the world's biggest retail company.” Hubert Burda

Consumer spending makes up around 68 percent of the nation’s gross domestic product. Consumer spending is individuals and families purchasing groceries, clothing, recreation, stocks, insurance, education and much more. The transactions cover a broad swath of economic activity.

Much of the nation’s consumer spending is captured via retail trade. A useful retail trade definition is “the re-sale (sale without transformation) of new and used goods to the general public, for personal or household consumption or utilization.” Not all consumer spending is captured through retail trade transactions, but a large share is.

Broad-category examples of retail trade sectors are motor vehicle sales, furniture stores, electronic stores, building material stores, grocery stores, pharmacies, gas stations, clothing stores and department stores, among others.

Then there is the relatively new and emerging part of the retail trade sphere — non-store retailers. These are establishments that sell products on the internet. Examples include Amazon, Zappos, Overstock.com, or eBay. These types of retailers have grown rapidly in the past 15 years and their presence is reshaping the retail trade landscape.

Whereas in the past nearly all retail transactions were done through traditional brick-and-mortar stores, now a significant and growing segment is diverted to internet sales. The consumer shops online and goods are delivered to the customer’s doorstep. One can see that the number of brick-and-mortar stores and the level of local sales across the country are being endangered by this economic evolution.

The brick-and-mortar reduction is beginning to show its economic presence in the United States employment numbers. While the U.S. economy is finally expanding at a healthy pace this side of the Great Recession, one of the few industries not rising with this tide is retail trade. While overall retail sales are increasing, employment is not.

Traditionally, as a population increases, retail trade employment grows simultaneously, since population growth and consumer spending volume is an integrated dynamic. If studied deeply, a certain ratio of retail trade employment growth spawned from population growth would emerge. Before the internet, the vast majority of all consumer sales occurred in the immediate community or region. But now, the internet is diverting these sales away from the local community — and with internet sales growing, its market share will increase.

We do not yet know how much brick-and-mortar erosion will eventually occur. And will such a phenomenon hit some areas more than others (e.g., urban vs. rural, or local vs. tourist spending)? These are touch points that economist will be watching as this Internet sales phenomenon continues to grow within the national and Utah economies.

In light of this change, in this quarter’s Local Insights we are profiling retail trade employment throughout Utah’s local regions. This can offer a profile of where retail trade is now in a local economy, and possibly how much of the sector could become vulnerable to the internet-sales phenomenon.

All regions can be viewed through the Local Insights web portal. The following is a retail trade profile for the Southwest region:

Trending Upward


Just how important is retail trade employment in the southwest corner of Utah? In 2016, roughly 12,400 Southwest Utah workers were employed in retail trade representing 14 percent of total nonfarm employment in the region. That’s slightly higher than the statewide retail average of 12 percent. The current employment level represents a regional high point. Moreover, despite the revolution in online buying, employment in retail trade has trended upward in Southwest Utah — although it has ebbed and flowed during boom, recession and recovery. Of course, the region’s population growth provides a major factor in retail trade employment expansion in Southwest Utah.

In most Southwest Utah counties, growth rates swelled in the mid-2000s, toppled during the recession and surged back as the recovery took hold. Yes, retail trade is certainly susceptible to the business cycle. During the recovery, Garfield County led the pack with early retail trade gains only to experience job losses when other counties picked up speed. In contrast, both Kane and Iron counties were slow to add retail jobs in the recovery period. Retail trade employment in both counties just barely returned to the pre-recession peak levels.

Tis the Season


Retail trade employment can be very seasonal in nature. In both the Garfield and Kane economies, a strong tourism and recreation component produces a significant seasonal pattern with employment peaking in the summer months and bottoming out in January or February. In Garfield County, retail trade jobs can double between trough and peak. While tourism isn’t as profound in Beaver County, retail employment also peaks in summer as the industry services travelers along the I-15 corridor. Washington and Iron counties experience less seasonality, but also see their lowest retail employment levels as the year begins. However, in these two counties, holiday shopping creates a slight seasonal peak in December. This pattern follows the statewide lead.

Dependency


Some counties in Southwest Utah are more dependent on retail trade employment than others. Statewide, retail trade employment accounts for about 12 percent of total nonfarm jobs. Beaver (17 percent), Washington (15 percent) and Iron (14 percent) counties all show higher percentages of retail trade employment than the state. Iron and Washington are self-contained, regional shopping centers which probably accounts for their higher-than-average retail shares.

Despite their tourism-dependent economies, Kane and Garfield counties show smaller percentages of retail trade employment overall. This is partially due to the high levels of leisure/hospitality employment in these counties. In addition, tourism’s contribution to retail trade employment typically lasts only half the year.

Location quotients (LQ) provide a different way of looking at the importance of an industry. These ratios compare an area’s industry employment share to that of the nation. A retail trade LQ of 1 indicates the area’s industry employment makes up the same share of employment as that industry does nationwide. A location quotient greater than 1 means the area’s industry has a greater employment share than the United States. Utah’s retail trade location quotient measures just higher than 1. However, Beaver, Iron and Washington counties all have retail trade location quotients of 1.3 or higher, attesting to the magnitude of retail employment in these areas. On the other hand, Kane’s LQ is exactly 1 while Garfield County shows an LQ of 0.78. In other words, retail employment is far less important in Garfield County than in other Southwest Utah counties, the state and the nation.

Over time, the share of retail trade employment has remained fairly steady in the most populated Southwest counties. On the other hand, in Beaver and Garfield counties, retail trade has taken on a more important employment role in the post-recession years.

Relationships


Population per retail worker also provides insights into the retail trade industry’s local importance. Statewide there are roughly 16 residents per retail trade job. Despite being the most tourism-dependent county in Utah, Garfield County shows 24 residents per retail trade worker, the highest in the region. On the other hand, Washington County’s population per retail trade job measures less than 15, which seems to reflect its importance as a regional shopping destination. In general, the ratio of population to retail trade employment has trended downward, which seems to reflect the incursion of online shopping.

Down to Subsectors


In Southwest Utah, general merchandise stores (e.g., Wal-Mart, Target, Dillards, JC Penny) account for the largest subsector share of retail trade workers — 20 percent. Food and beverage stores ran neck-and-neck with these stores with just less than 19 percent of total employment. Motor vehicle/parts dealers (13 percent), building materials/garden stores (12 percent) and gasoline stations (10 percent) are also major employment players in retail trade.

The job shares of retail trade subsectors vary between Southwest Utah and the state overall. Southwest Utah shows higher employment shares in building material and garden stores, food and beverage stores and gasoline stations than Utah. In contrast, the region shows smaller employment percentages in clothing stores, electronics stores and especially non-store retailers. In other words, Southwest Utah employment does not appear to be benefitting from online sales.

A Fair Share?

Since 2000, general merchandise stores have slowly eked out a higher share of retail trade employment. In 2000, roughly 16 percent of Southwest Utah retail employment was at general merchandise stores. Since that time, general merchandise stores have increased their share by 3 percentage points. Building material and garden stores have also seen employment shares increase as several big box retailers entered the area.

On the other hand, food and beverage stores’ share of retail trade employment has decreased slightly. The inclusion of groceries at some big-box stores has probably tapped into some of the food and beverage store employment. On the other hand, many traditional grocery stores now also carry non-grocery items.

Wages


Retail trade is not known for its excessive wages. In 2016, only private education services, and leisure/hospitality services showed lower average monthly wages in Southwest Utah. Not only are retail trade hourly wages lower than average — many jobs are part-time, which contributes to its lower-than-average standing.

Statewide, the average monthly wage for a retail trade worker measures less than $2,600. Not surprisingly, the average retail trade wage measured even lower in all Southwest Utah counties. Nevertheless, a wide disparity in wages exists even within the region. In Washington County, the 2016 average monthly retail trade wage registered at about $2,200, while in Garfield County, the average was a mere $1,400. Iron County’s wage ($2,100) measured slightly below the Washington figure. Beaver ($1,600) and Kane ($1,600) landed closer to the Garfield County wage.

Interestingly, during the pre-recession years when Washington County experienced rapid employment growth and short-term labor shortages, its average monthly retail wage actually surpassed the statewide figure. (It was that whole supply and demand thing at work.) Of course, once recession hit, wages returned to a more historical relationship.

The Same, but Different


Retail trade wages also show a notable variety in relationship to the average county wage. Statewide the retail trade industry wage measures 70 percent of average. In both Iron (84 percent) and Washington (80 percent) counties, retail trade wages compare more favorably to the overall county average. In Beaver and Garfield counties the retail wage measures about 56 percent of average; Kane County’s figure is slightly higher at about 65 percent.

Between 2001 and 2016, the gap between the retail trade industry wage and the average wage widened in all counties — and the state. This suggests that wages in other industries have increased faster than those in retail trade.

Within the retail trade industry in Southwest Utah, jobs at motor vehicle/parts dealers show the highest average wage followed by building materials and garden stores. On the low end of the scale, clothing stores paid the lowest wages.

Thursday, June 1, 2017

Is Your Town Growing?

U.S. Census Bureau releases 2016 City Population Estimates


By Lecia Parks Langston, Senior Economist

“A city is more than a place in space, it is a drama in time” –Patrick Geddes

Most of Utah’s cities and towns grew in 2017, according to population estimates recently released by the U.S. Census Bureau. Lehi even ranked 11th among the nation’s fastest-growing large cities. However, not all Utah’s cities and towns experienced growth.

Use the visualization and bullet points below to explore population trends for individual townships.


• The old Geneva Steel Mill site continues to be fertile ground for population expansion. Vineyard was once again the fastest growing city in Utah. However its rate of growth has slowed dramatically since 2015. In addition, Vineyard remains relatively small in size.

• Herriman added the highest number of new residents of any city in Utah (4,550) followed by Orem, Lehi and South Jordan. All showed higher population gains than Salt Lake City — Utah’s most populous city. Herriman also showed the second-fastest rate of expansion in 2016.

• St. George was the only city outside the Wasatch Front to increase its population by more than 2,000 residents.

• The top four population-gaining cities in Utah are all located in southern Salt Lake County or northern Utah County, as the metropolitan population continued to spread outward from the large city centers. Fastest-growing larger communities also tended to be located near the Salt Lake County/Utah County border.

• Due to the nature of percent-change mathematics, several small towns (such as Monticello, Mantua, Francis, Interlaken and Hideout) showed high growth rates although their new-resident counts measured relatively low.

• The Census Bureau estimates that most of the cities and towns showing population declines were located in the Uintah Basin, Carbon County and Emery County. Declines in resource-based employment have spearheaded these population declines.

• In addition, Millard, Piute, Garfield and Wayne counties displayed a significant number of contracting townships.

• Salt Lake County remains home to five of the 10 largest cities in the state. Utah County accounts for another two in the top 10. St. George is the only city in the top-10 ranking located outside the Wasatch Front.

Tuesday, May 30, 2017

Understanding Utah’s Future Skill and Knowledge Needs

The Utah Department of Workforce Services releases Skill and Knowledge-based Projections

By Lecia Parks Langston, Senior Economist

“It is possible to fly without motors, but not without knowledge and skill.” Wilbur Wright

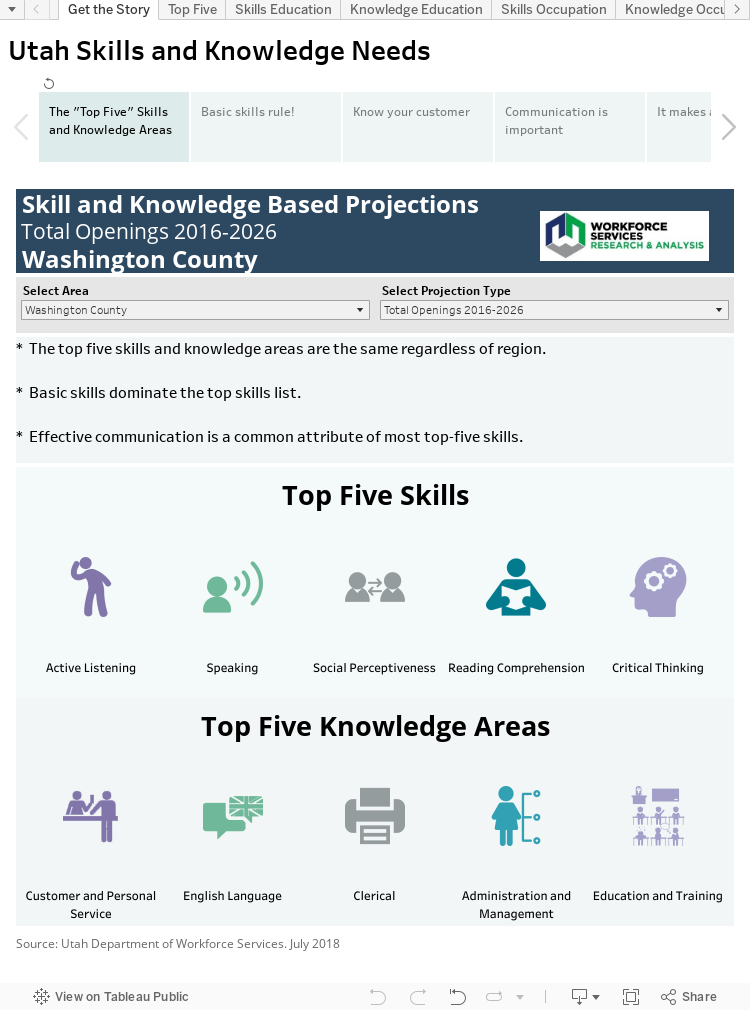
The following skill and knowledge projections suggest that the foundation for future workforce preparation relies on those old favorites “readin' and 'ritin' and 'rithmetic.” Technical skills and knowledge areas are also important, but rely on an excellent foundation in basic skill and knowledge areas.

• Utah occupational projections and the Occupational Information Network (O*Net) provide the foundation for these skills and knowledge estimates.

• “Basic Skills” dominate the top 10 in-demand skills, suggesting a need to ensure training on “the basics” for all prospective workers.

• Basic skills needs cross occupational and educational boundaries. • Basic skills make changing occupations possible as the labor market changes.

• Communication skills and reading rank highest on the top skills list, followed by critical thinking. • The top five skill and knowledge areas are the same for every region of the state.

• The top 10 in-demand skills change very little regardless of the occupational training level.

• Customer Service ranks, by far, as the knowledge area with the highest projected demand.

• For occupations requiring formal training past the high school level, competence in English, computers/electronics, and mathematics becomes increasingly important — although these skills are in demand for employment at all training levels.

• Short-term shortages for certain technical skills may seem to displace the overarching need for all workers to have a strong foundation in basic skills in training discussions.


Tuesday, May 9, 2017

Who Moved to Washington County?

The Characteristics of Washington County In-migrants


By Lecia Parks Langston, Senior Economist

“Human beings are the only animal that thinks they change who they are simply by moving to a different place.” Douglas Coupland

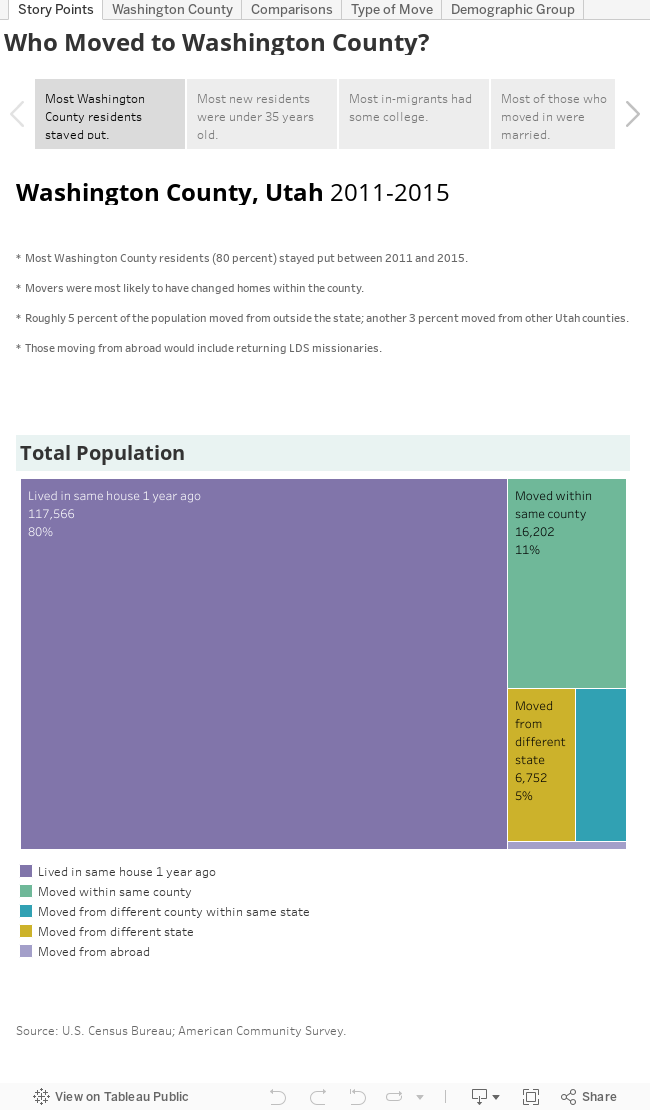
In the past several decades, strong population growth has seemed like a way of life in Washington County. As the county’s population has swelled, growth rates have declined. However, large numbers of people still migrate to the area to enjoy its natural beauty and lifestyle. Who are these in-migrants? Conventional wisdom would tell you in-migrants are mostly senior citizens. However, data from the U.S. Census Bureau’s American Community Survey tells a different story.

The following visualization includes demographic averages of Washington County in-migrants for the years 2011 through 2015 (the most recent data available). Click through the gray header boxes for the basic story. Then to dig deeper, use the tabs at the top of the visualization.

Thursday, April 27, 2017

Census Bureau Tool Provides Labor-Force Insight for Utah

By Mark Knold and Lecia Langston

Across the United States, jobs are quantified through each state’s unemployment insurance program. Those programs provide the potential for laid-off workers to receive unemployment benefits — the goal being to bridge the gap between workers’ lost jobs and their next jobs. An eligible recipient’s weekly benefit amount is based upon their earnings from recent work. This begs the question, how does Utah’s unemployment insurance program know how much an individual recently earned while working?

That answer is supplied by all businesses that hire workers, as they must report their employees and pay as mandated by the unemployment insurance laws. Companies identify their individual workers and those workers’ monetary earnings for a calendar quarter. As businesses are identified by their industrial activity and geographic location, it is through the unemployment insurance program that aggregate employment counts by industry and location are calculated.

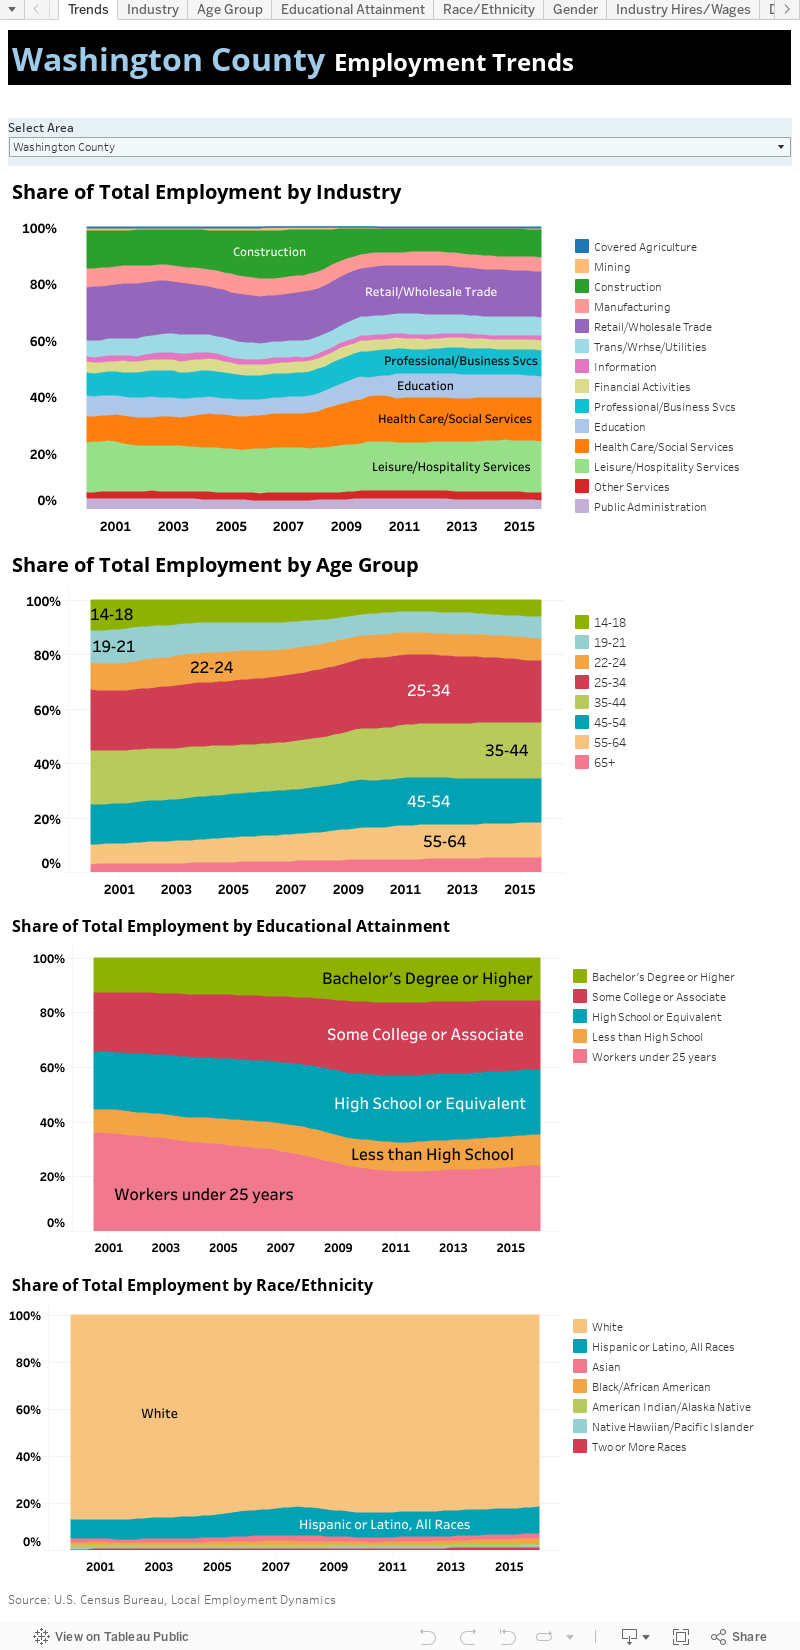
Yet each state’s profiling of individuals is quite minimal in the unemployment insurance program. The U.S. Census Bureau can bring more light to the overall labor force by supplementing said information with gender, age, race/ethnicity and educational attainment (imputed from American Community Survey responses) for Utah’s labor force.

The Census Bureau packages this information through their Local Employment Dynamics program and makes available said data on its website. Here at the Department of Workforce Services, we recently downloaded and packaged Utah-specific data from said website and summarized it in the attached visualization.

Various data “tabs” are available, presenting Utah’s economy from different angles, ranging from industry shares within the economy to the age-group distributions of the labor force, to gender and race distributions. These labor variables can be viewed for the state as a whole, or by each individual county.


Health Insurance: Who’s covered in Utah?

Census Bureau Estimates Provide Answers about Utah Health Insurance Coverage


By Lecia Parks Langston, Senior Economist

“Most Americans want health insurance.” Jacob Lew

The U.S. Census Bureau just published its Small Area Health Insurance Estimates (SAHIE) for counties and states while the national discussion on health care laws receives renewed attention. Is this a coincidence? Yes, but a timely one. This post examines how health insurance coverage for Utahns has changed and also the demographics of who has coverage and who does not.

Tracking Utahns Under 65 Years of Age

Small Area Health Insurance Estimates cover the population under 65 years of age. Of course, virtually all residents 65 and older are covered by government-provided Medicare. Because the estimates date back to 2008, two years before the signing of the Affordable Care Act (ACA), the available figures provide an indication of the effect of the ACA on health insurance coverage in Utah and its counties.
More Utahns have Health Insurance

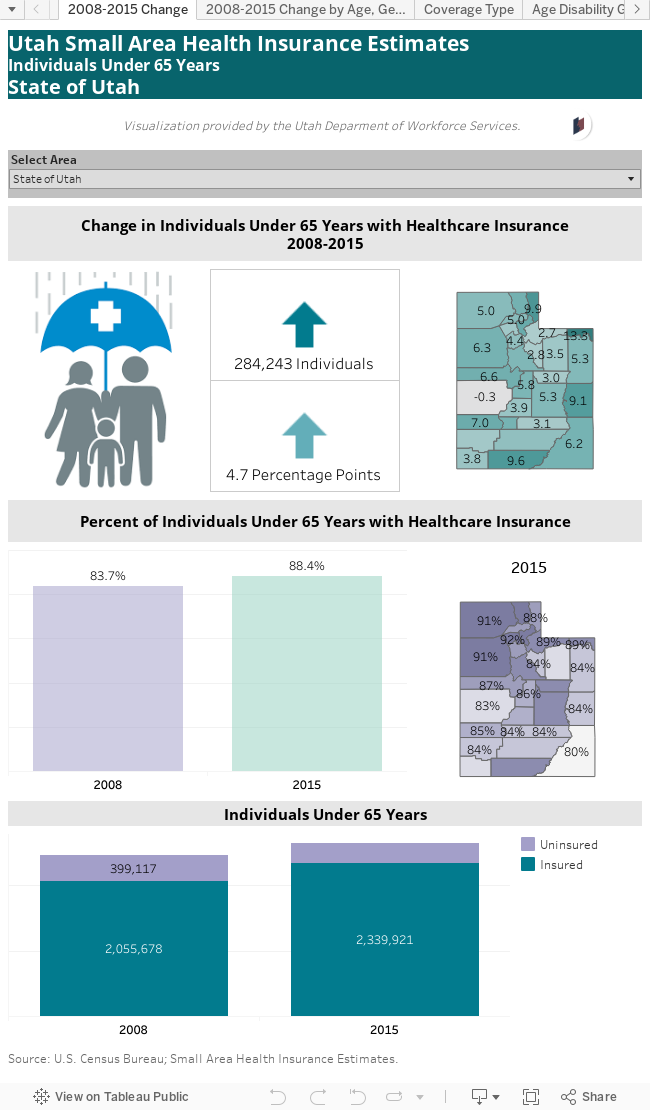
Between 2008 and 2015, the number of Utahns under 65 years old covered by health insurance increased by 284,000. Not only did the actual covered increase, but the share of non-senior population with health insurance also gained ground expanding from less than 84 percent to more than 88 percent — an increase of 4.7 percentage points.

Only Millard County experienced a very slight 0.3 percentage point decline in health insurance coverage although the actual number of persons covered increased by 113. Daggett, Rich, Kane and Grand counties showed the highest growth in under-65 coverage; each showed increases of at least 9 percentage points.

In 2015, counties in northern Utah generally showed the highest level of non-senior health insurance coverage. In Morgan, Davis, Box Elder, Tooele and Cache counties, health insurance rates top 90 percent. On the other end of the scale, rural counties in central and southern Utah display the lowest coverage. In San Juan, Millard, Duchesne and Wayne counties, health insurance rates for those under 65 measured 83 percent or less.

Those under 19 saw the greatest gains. Coverage rates for these young people increased from 87 percent in 2008 to 93 percent in 2015. Utah males experienced a larger gain in coverage between 2008 and 2015 (5 percentage points) than did females (4 percentage points), although females were more likely than men to carry health insurance in both years. Health insurance rates for those with the lowest incomes showed the most improvement (10.4 percentage points). However, their coverage shares remain roughly 10 points below average.

Wait, There’s More…

Friday, March 31, 2017

What's Your County's Population?

U.S. Census Bureau releases 2016 county population estimates.


By Lecia Parks Langston, Senior Economist

“In a region with a growing population, if you’re doing nothing, you’re losing ground.” Stewart Udall

The Census Bureau just released population estimates for counties and metropolitan statistical areas across the United States. Yes, it was just a few months ago that Utah made headlines as the fastest-growing state in the nation. So, it should come as no surprise that several Utah sub-areas also appeared on the fastest-growing lists.

San Juan County ranked as the fastest growing county in the nation with a 2016 growth estimate of 7.6 percent. Keep in mind that less than 17,000 people live in the county. In other words, a small numeric change in this less-populated county can result in a large percent change.

In addition, three Utah regions ranked among the top 20 fastest-growing Metropolitan Statistical Areas in the country. The St. George, Utah MSA (sixth), Provo-Orem, Utah MSA (seventh) and the Logan, Utah-Idaho MSA (20th) all attained top-20 status. See additional information on the estimates after the “jump.”


Pick a Number, Any Number


Because the Census Bureau actually counts the population only once every decade, these figures are estimates. Plus, they aren’t the only estimates in town. The Kem C. Gardner Policy Institute has recently assembled the Utah Population Committee (UPC) to reinstitute the population-estimates work previously conducted by the Utah Population Estimates Committee (UPEC). The estimates can be found here.

Census Bureau estimates use the same methodology in producing population figures for every county in the nation. Therefore, for nationwide comparisons, Census Bureau estimates may have the advantage. On the other hand, UPC population estimates have the benefit of local-analyst expertise and additional data sources.

Tuesday, October 18, 2016

Washington County Economic Update

April marked the fastest year-to-year nonfarm job growth in Washington County since the end of the recession. While the rate of expansion and slipped back a notch by the end of second quarter, it remained noticeably higher than the 5-percent expansion that has characterized the recovery. Continued growth at this level could signal an overheated economy. Interestingly, several industries actually lost employment. As in most Utah counties, Washington County’s saw its jobless rate increase in the first half of the year only to retreat in recent months. Strong job growth and limited unemployment insurance claims activity suggest that labor force entrants and re-entrants are temporarily inflated the unemployed totals. Construction in both residential and nonresidential sectors is up dramatically compared to last year, while gross taxable sales remained robust.

  • Between June 2015 and June 2016, Washington County added almost 4,000 new jobs for a growth rate of 7 percent. 
  • Industries making the largest employment contributions included healthcare/social services, construction, retail trade, professional/business services and transportation. 
  • Government and real estate actually showed noticeable employment contraction. 
  • Washington County showed a brief uptick in joblessness during spring and early summer as workers entered and reentered the labor market. 
  • The county's jobless rate as returned to its previous level in recent months, measuring only 3.7 percent in August 2016. 
  • New claims for unemployment insurance followed a seasonal pattern in the eight months of 2016 and provide no signs of large lay-offs. 
  • Retail trade, professional/business services and leisure/hospitality services (all with seasonal or temporary characteristics) have generated the largest numbers of first-time claims so far this year. 
  • Not only did employment increase at a rapid rate, the county’s second quarter 2016 average monthly wage improved by a robust 4.5 percent over the previous year. 
  • Both nonresidential and residential permitting increased substantially during the first eight months of 2016. 
  • New home permits are up 39 percent over last year, although a portion of the new permits are for much needed apartments. 
  • Washington County’s gross taxable sales increased by a robust 8 percent between the second quarters of 2015 and 2016. 
  • Retail sales proved particularly strong with auto dealers leading the way. In addition, tourism-related accommodations and food service sales increased decidedly.

Kane County Economic Update

Kane County job growth eased back a bit in second quarter, but still remained moderate. Job losses in a few industries cooled overall expansion. Despite employment expansion and the lack of unseasonal unemployment insurance claims activity in the first half of the year, joblessness edged up slightly during spring and early summer as workers entered or reentered the labor market. However, joblessness has retreated in recent months. Nonresidential construction permitting has surged in 2016, while the value of newly permitted homes slipped. However, a good labor market performance combined with strong sales expansion points to a healthy Kane County economy.


  • Kane County’s nonfarm employment increased by 2.6 percent between June 2015 and June 2016, adding nearly 100 net new jobs. 
  • The major industries were split into job-gaining and job-losing camps with mining, construction, manufacturing and financial activities making the strongest games. 
  • The largest job –losing industries included leisure/hospitality services and government. 
  • As in many Utah counties, joblessness in Kane County has crept up in spring and early summer only to decline in recent months. 
  • At 3.8 percent (August 2016), the county’s unemployment rate remains low. 
  • First-time claims for unemployment insurance seem to be following a seasonal pattern with no cyclical disturbances. 
  • The seasonal leisure/hospitality services industry has generated the highest number of new claims so far in 2016. 
  • However, construction, retail trade and mining also showed a significant number of claims. 
  • After a lull in wage growth earlier in the year, Kane County produced a strong 4.6 year-to-year change in its average monthly wage in second quarter 2016. 
  • The permitting of hotels/motels, a professional building and a retail establishment helped drive up Kane County nonresidential construction values for the first eight months of 2016. 
  • However, while the number of newly permitted home is up, the value of those permits dropped substantially from 2015. 
  • Gross taxable sales jumped up 10 percent between the second quarters of 2015 and 2016. 
  • A dramatic increase in sales in the accommodations industry proved the primary factor in this very strong expansion.
  • Iron County Economic Update

    Iron’ County’s labor market heated up in the second quarter of 2016. Keep in mind that this scorching level of job growth is not sustainable and should be watched for signs of overextension. Also, several industries experienced job losses. Nevertheless, the current employment gains mark a welcome respite from earlier years. As in most Utah counties, joblessness ticked up in spring and early summer only to subside in recent months. The county’s rate remains virtually unchanged from August of last year. First-time claims for unemployment insurance showed an unseasonal increase earlier in the summer (contributing to higher joblessness), but have since abated. Construction permitting is down from last year, but only because permitting in 2015 measured unusually high. Gross taxable sales rounded out this bright economic picture with a health performance.

    • Iron County added nearly 1,100 new jobs between June 2015 and June 2016 for a sizzling growth rate of nearly 7 percent. 
    • Retail trade, government, leisure/hospitality services, healthcare/social services and construction all contributed at least 100 positions each to the overall job improvement. 
    • However, not all industries shared in the employment joy. Information, mining and wholesale trade all lost notable numbers of jobs. 
    • Joblessness increased in spring and early summer as layoffs took their toll, but has rolled back somewhat in recent months. 
    • In August 2016, the county’s unemployment rate measured 4.4 percent, roughly equal to a year ago. 
    • First-time claims for unemployment insurance measured noticeably higher than average during the summer months, but have since subsided. 
    • Construction has generated the largest number of new claims so far this year as projects have come to a close. 
    • However, professional/business services (which includes temp agencies), retail trade and leisure/hospitality services also experienced strong claims activity. 
    • After stalling somewhat earlier in the year. 
    • Iron County’s average monthly wage resumed its upward trend with 3-percent growth between the second quarters of 2015 and 2016. 
    • Iron County’s construction permit values showed a significant decline for the first eight months of 2016 due to the comparison with usually high nonresidential permitting in 2015. 
    • On the other hand, homebuilding is up significantly from last year. 
    • Gross taxable sales also showed strong improvement with a second quarter year-to-year increase of nearly 8 percent. 
    • Sales gains in retail trade proved particularly robust.

    Garfield County Economic Update

    Garfield County’s employment levels failed to demonstrate steady improvement as 2016 progressed. Despite some brief signs of progress, by the end of second quarter, jobs showed continuing contraction. Joblessness edged up for the first half of the year only to slip back down in July and August. The late summer improvement may signal better news on the jobs front. However, due to the seasonal nature of the economy, the county’s always high unemployment rate measures more than double the state average. On the other hand, first-time claims for unemployment insurance show no signs of nonseasonal activity. Gross taxable sales provide the best economic news with more than two straight years of expansion.
    • Between June 2015 and June 2016, Garfield County’s nonfarm jobs dropped by roughly 2 percent, representing a decline nearly 60 positions. 
    • Employment contraction in public education and transportation accounted for the lion’s share of job losses although leisure/hospitality services and construction took job hits as well. 
    • Healthcare/social services, manufacturing and retail trade added notable numbers of new positions but these gains were not enough to offset other losses. 
    • Garfield County’s already high jobless rate edged up in the first half of the year only to edge down in recent months. 
    • In August 2016, the county’s unemployment rate registered 8.4 percent. 
    • The seasonal nature of the Garfield County’s labor market results in a perennially high jobless rate. 
    • So far in 2016, first-time claims have followed a seasonal pattern with no sign of cyclical distress. 
    • Although Garfield County’s average monthly wage continues to increase, improvements are minor. 
    • Between the second quarters of 2015 and 2016, the average wage increased by less than 2 percent. 
    • Gross taxable sales continued as the brightest spot in the Garfield County economy. 
    • The second quarter year-over gain measured a robust 6 percent. 
    • Sales in the accommodations industry generated much of the additional sales with retail trade improving as well.